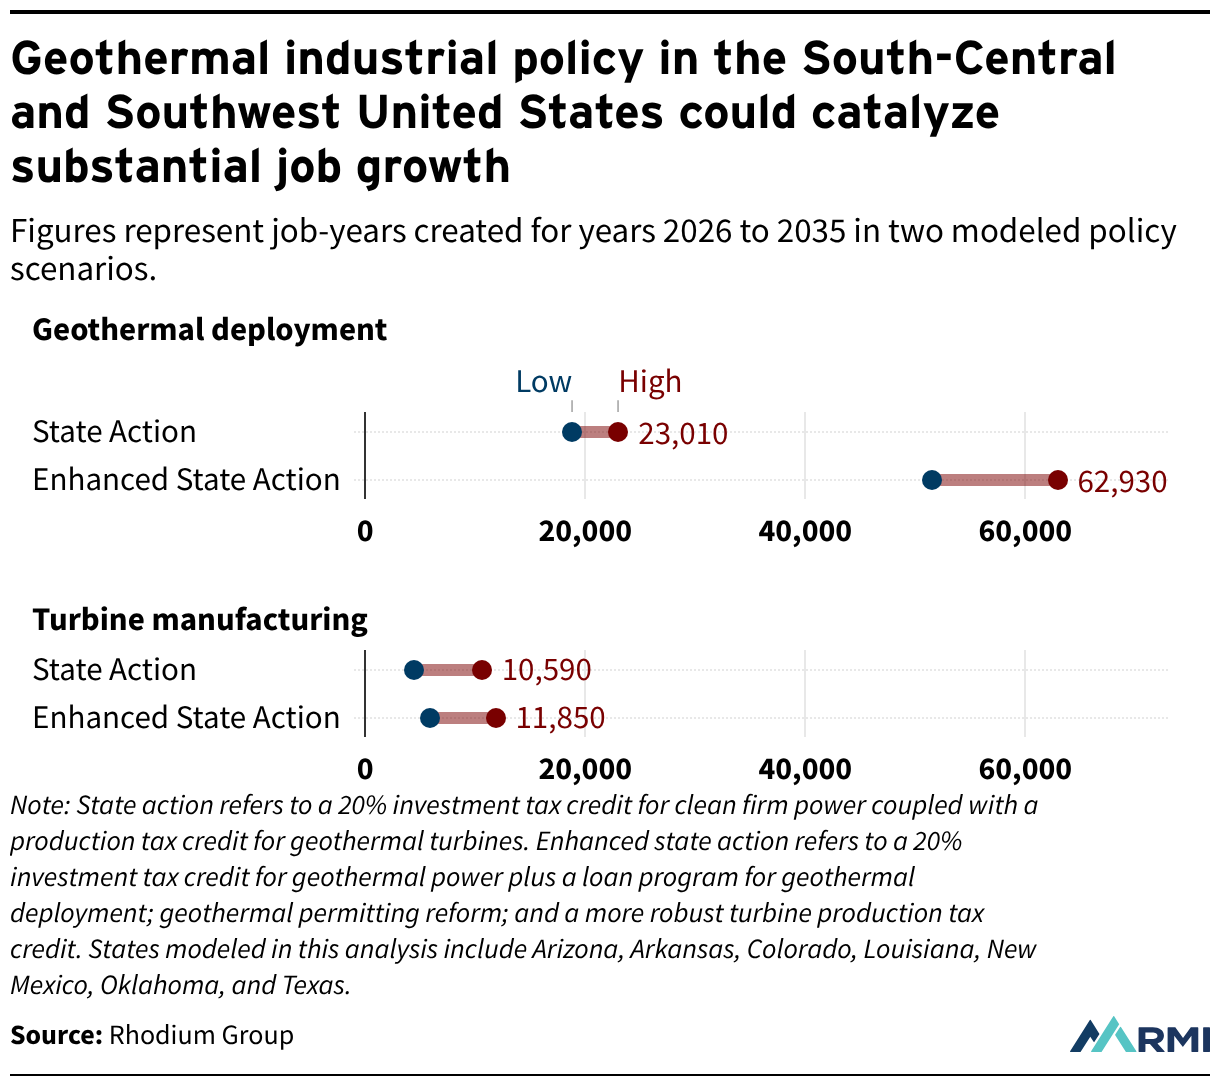
Geothermal industrial policy in the South-Central and Southwest United States could catalyze substantial job growth
Figures represent job-years created for years 2026 to 2035 in two modeled policy scenarios.


Figures represent job-years created for years 2026 to 2035 in two modeled policy scenarios.