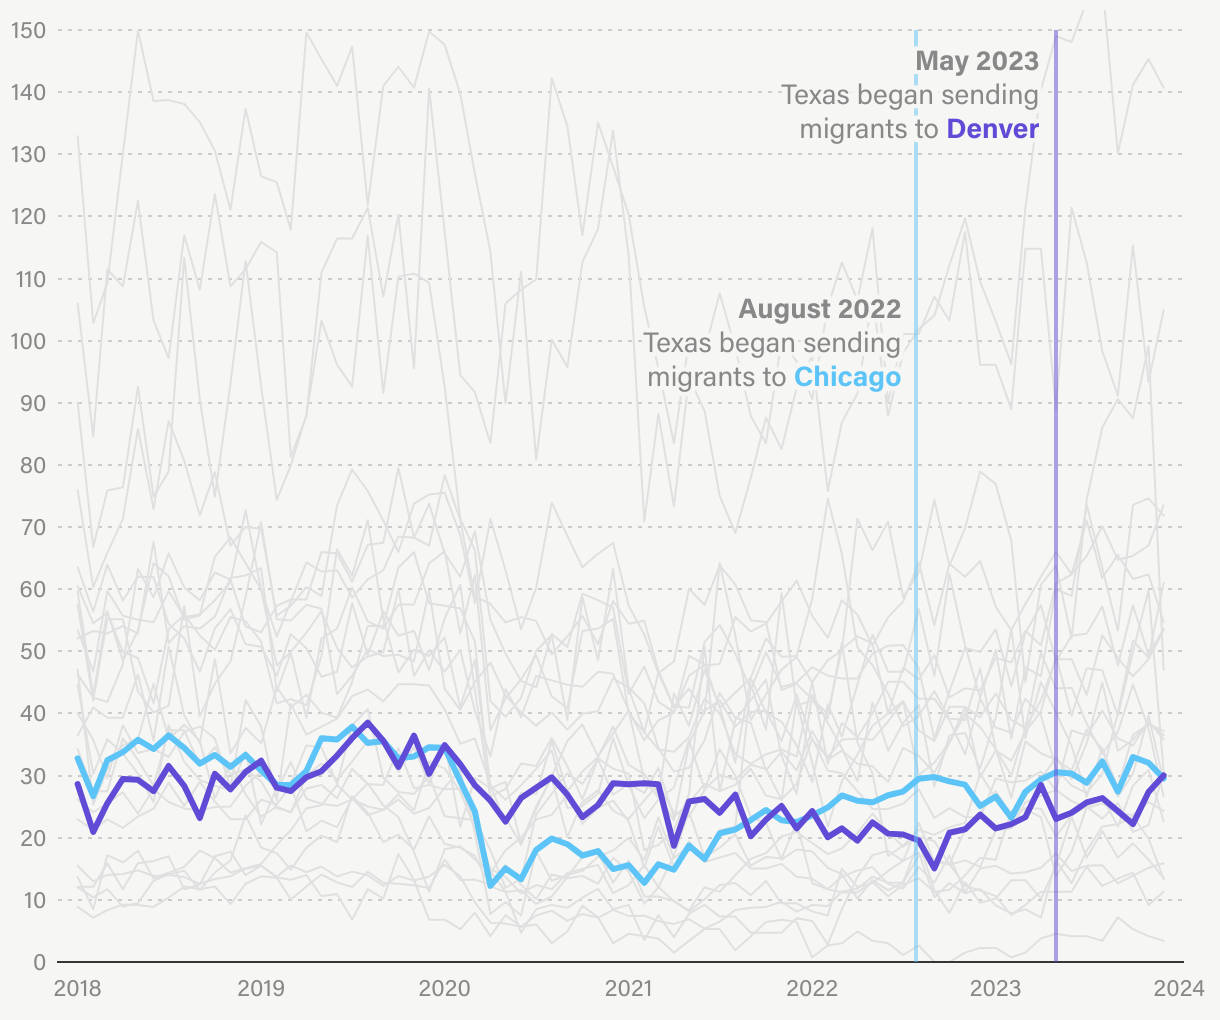
Reported shopliftings per 100,000 people
A line chart that shows how the rate of shopliftings reported to the police changed from 2019 to 2023. The chart includes trends from 25 cities, and highlights trends from Denver and Chicago — two cities that received more than 10,000 migrants from Texas. Both cities had relatively low shoplifting rates during this time period. Data from Chicago shows an increase in shoplifting since the end of 2021.