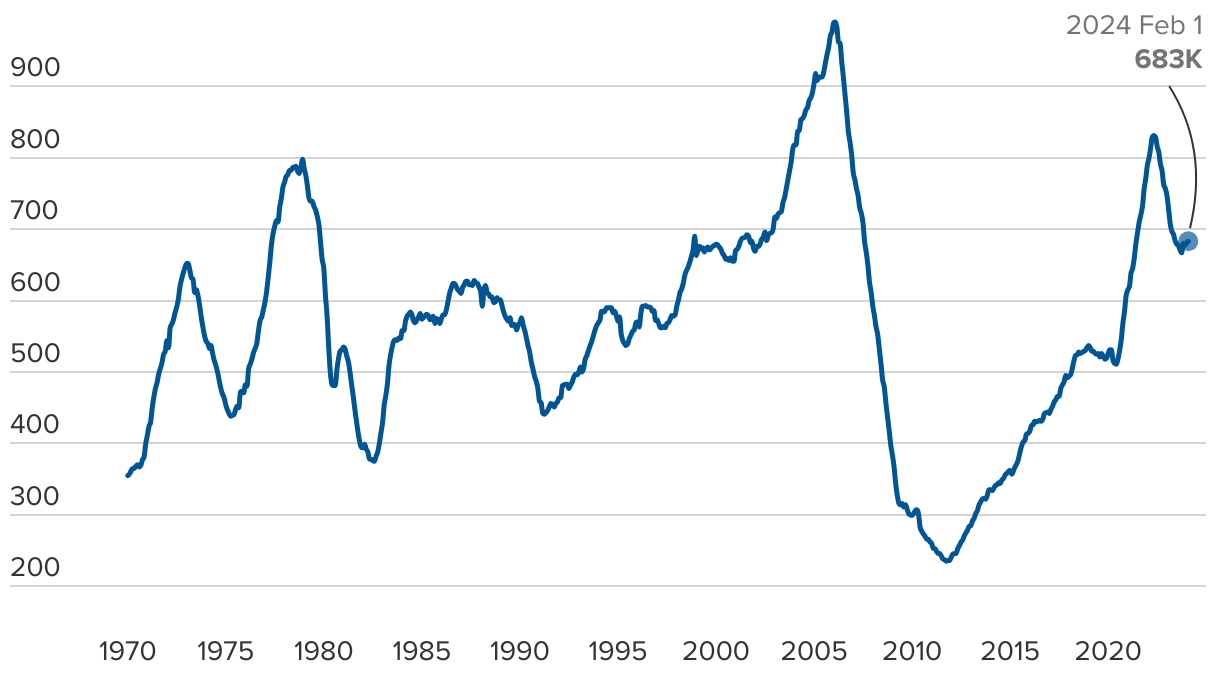
New privately-owned, single-family homes under construction in the U.S.
The line chart shows the amount of new, privately-owned, single-family homes under construction in the U.S. since January 7, 1971 to February 1, 2024. The monthly averages are in thousands and are seasonally adjusted.