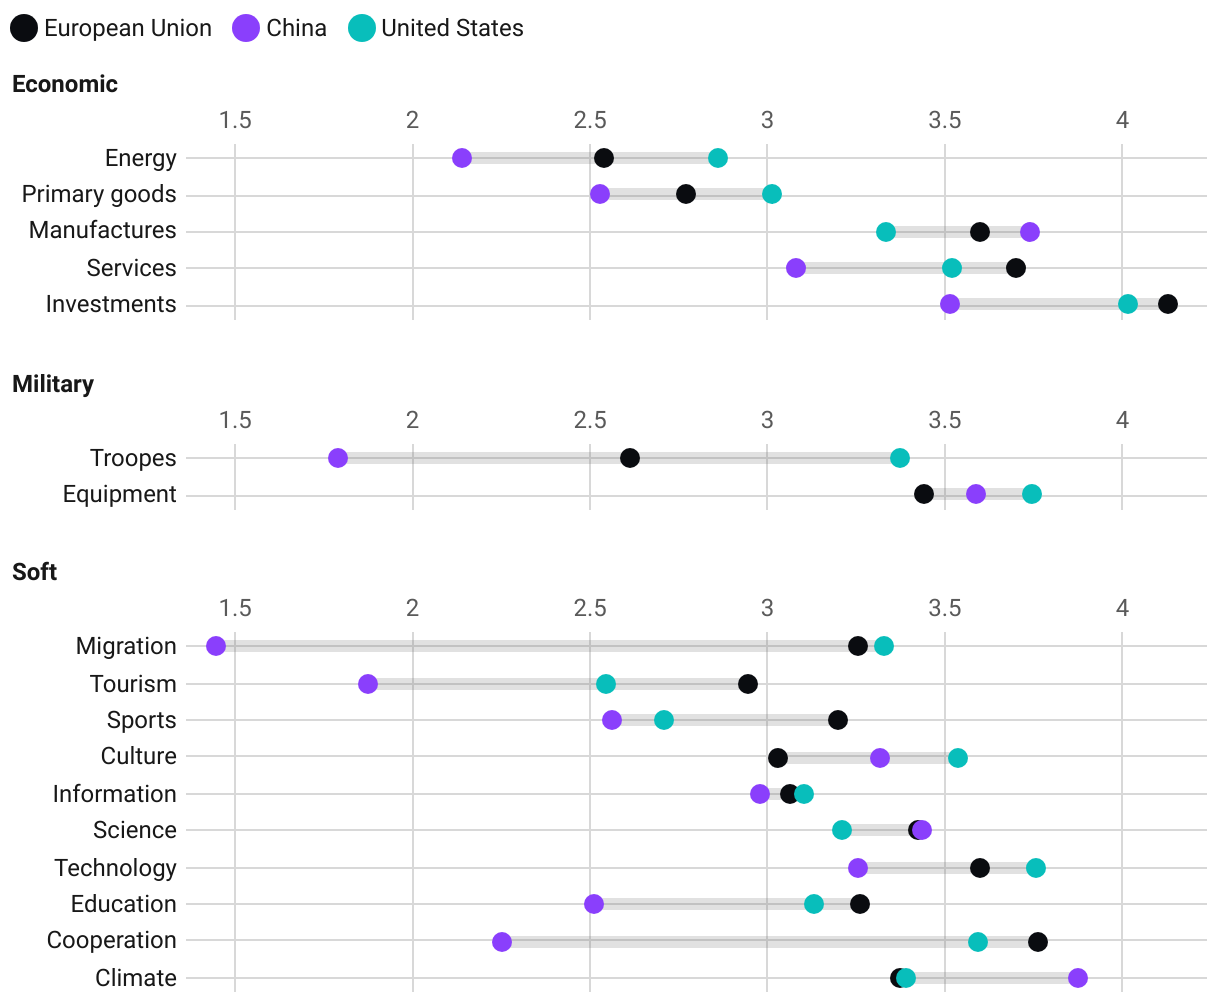
Dot plot showing the value of the US, China and the EU by dimensions and indicators (log scale). The distance between the US (cyan dots), China (violet dots) and the EU (dark blue dots) is narrower in the economic dimension and wider in the military and soft power dimensions, albeit with nuances. The US leads in energy and primary goods, China in manufactures, and the EU in services and investments. In the military realm, the gap stems largely from deployed troops, where the US leads, and regarding Equipment. China’s advantage is concentrated in just a few indicators, and the gap widens when it comes to soft power indicators such as Migration, Tourism, Sports, Education and Development Cooperation –areas traditionally at the core of soft projection–.