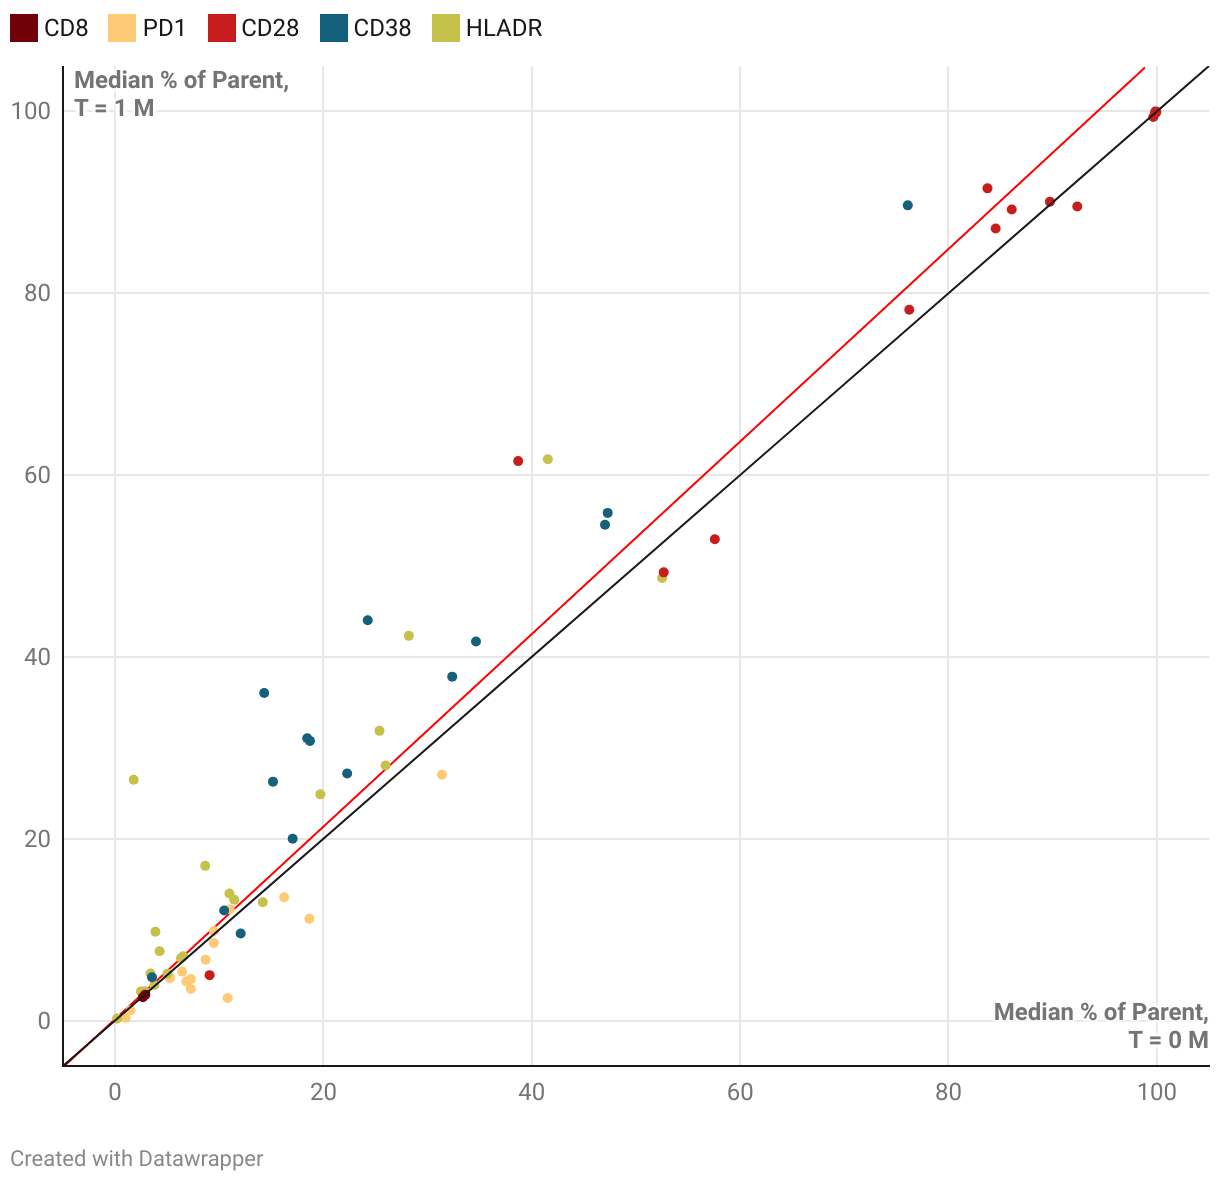
Correlation of Functional Subset Frequencies:
T = 1 M vs. T = 0 M
Data from the TokuKit stability study (n=3 donors), evaluated using a 25-marker spectral flow cytometry panel on fixed whole blood. For each functional subset within a parent cell population, the median percent frequency was assessed at T = 0 and T = 1 month post-fixation. Each point represents the correlation of the median percent of parent across the three donors between the two time points.
R = 0.871
p = 5.56e-23
y = 1.059x + 0.149