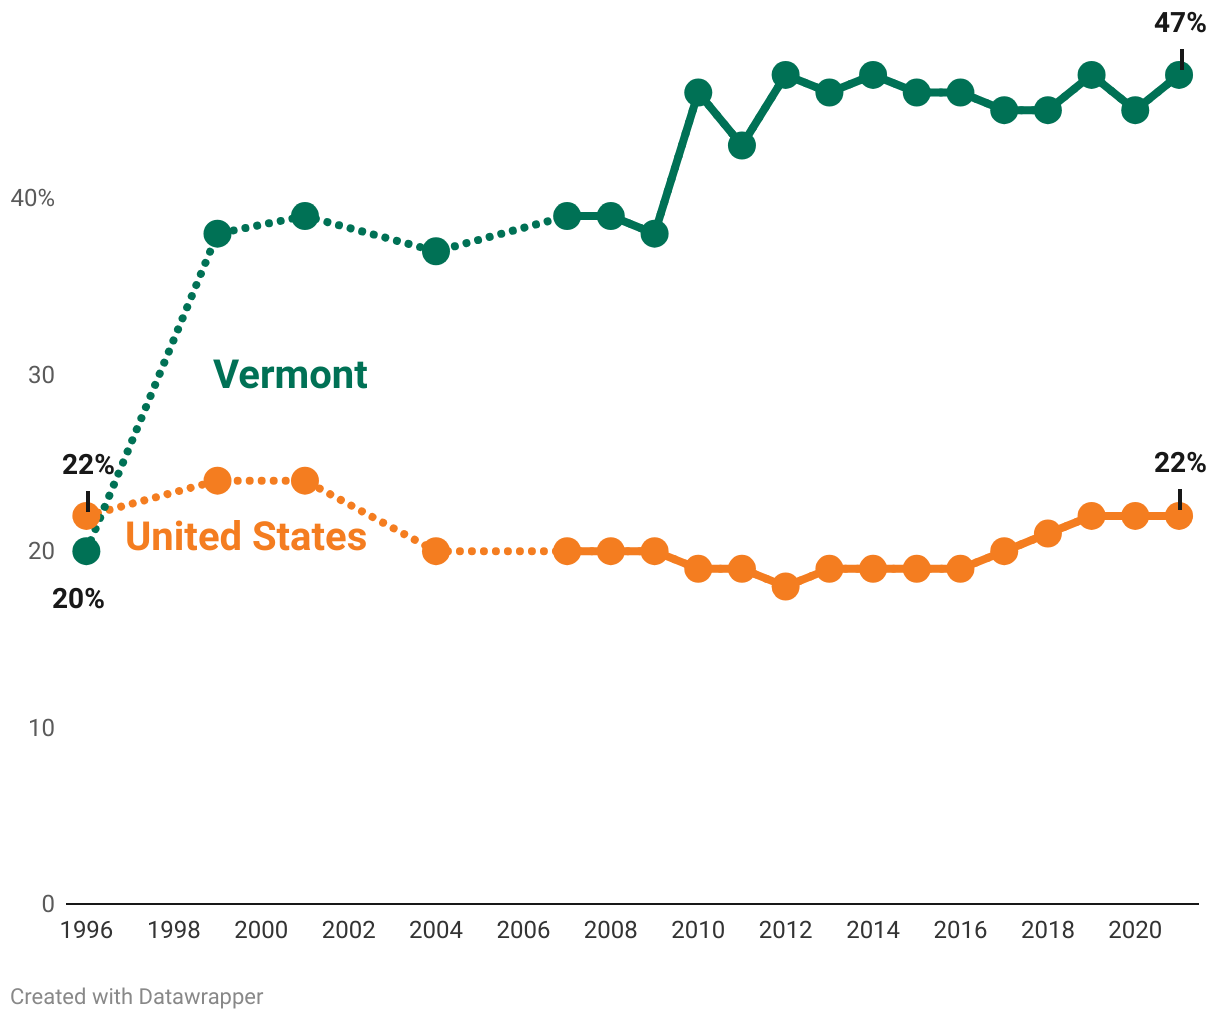
This line graph shows the percent of people receiving I/DD services who are employed. A green line shows the number of people in Vermont and a blue line shows the number of people across the USA. The Vermont line increases from 1996 (20%) to 2010 (46%) then stays steady to 2021 (47%). The line for the USA says fairly flat from 1996 (22%) to 2021 (22%).