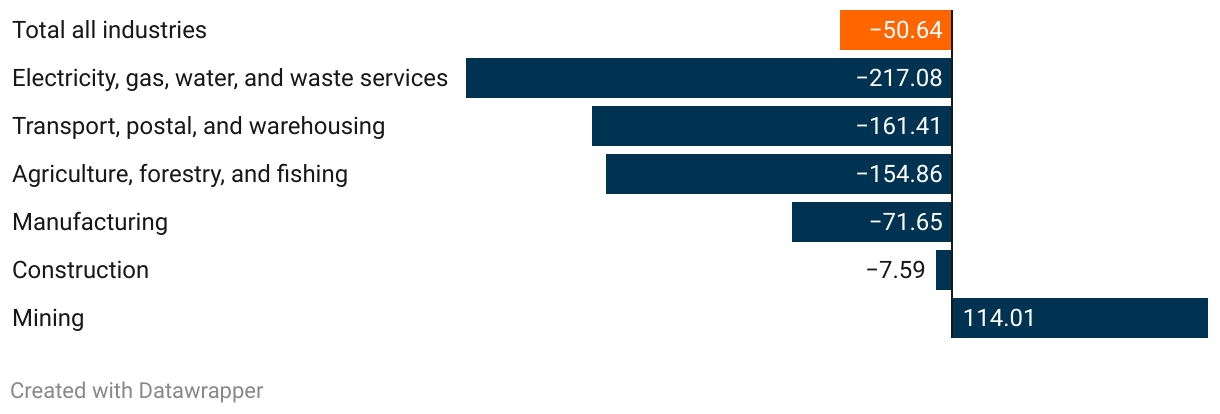
Kilotonne CO2 equivalent per 2009/10 $m GDP, 2019-22
(Please use a modern browser to see the interactive version of this visualization)