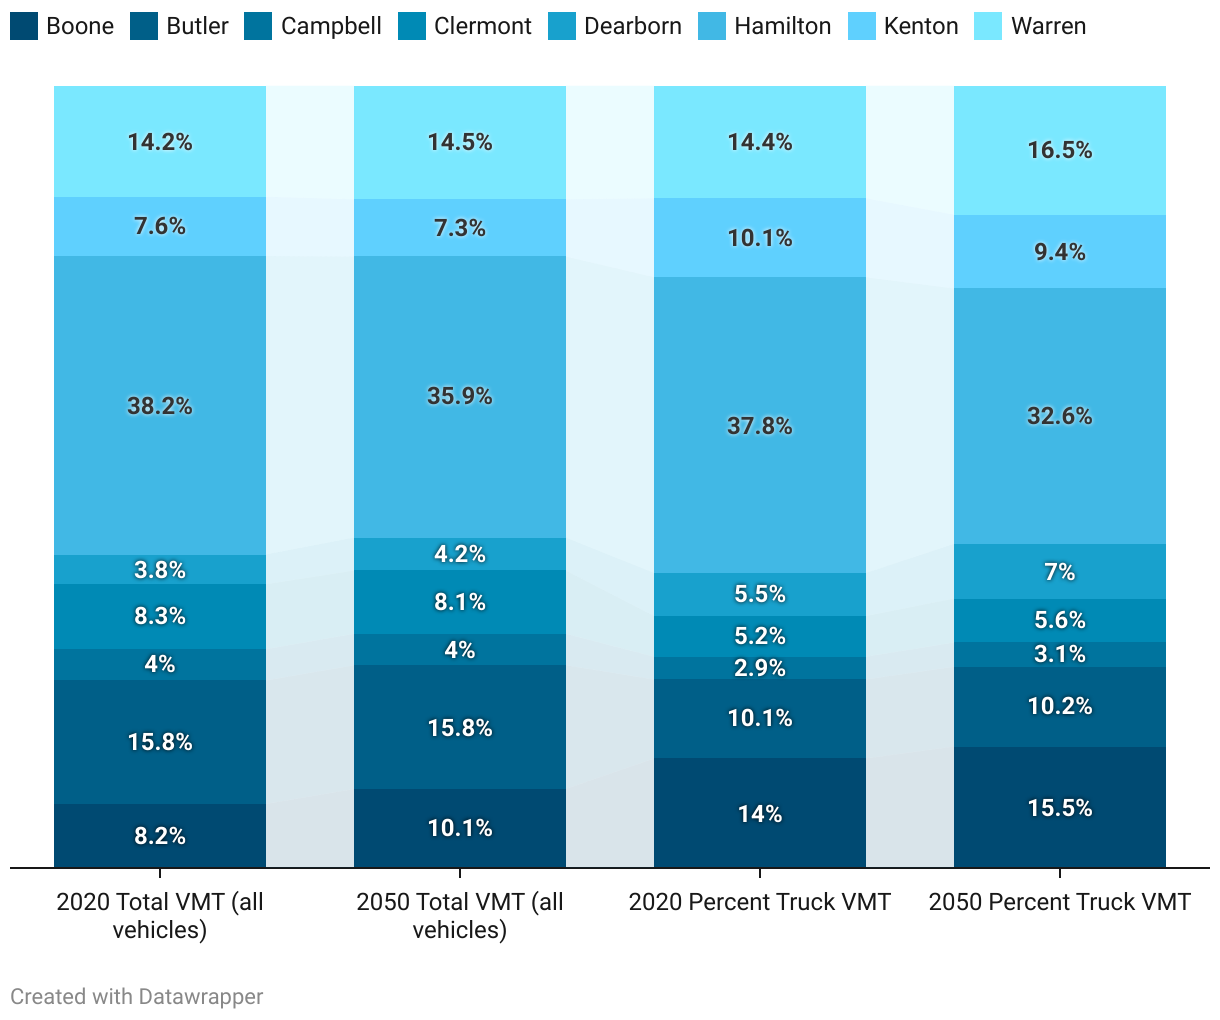
Percentage of Total Regional VMT and Total Truck VMT by County, 2020 and 2050
The chart consists of four columns. The two columns on the left break the Total Regional VMT (all vehicles) down by county percentage for Years 2020 and 2050. The two far right columns break the Total Regional Truck VMT down by county percentage for Years 2020 and 2050.