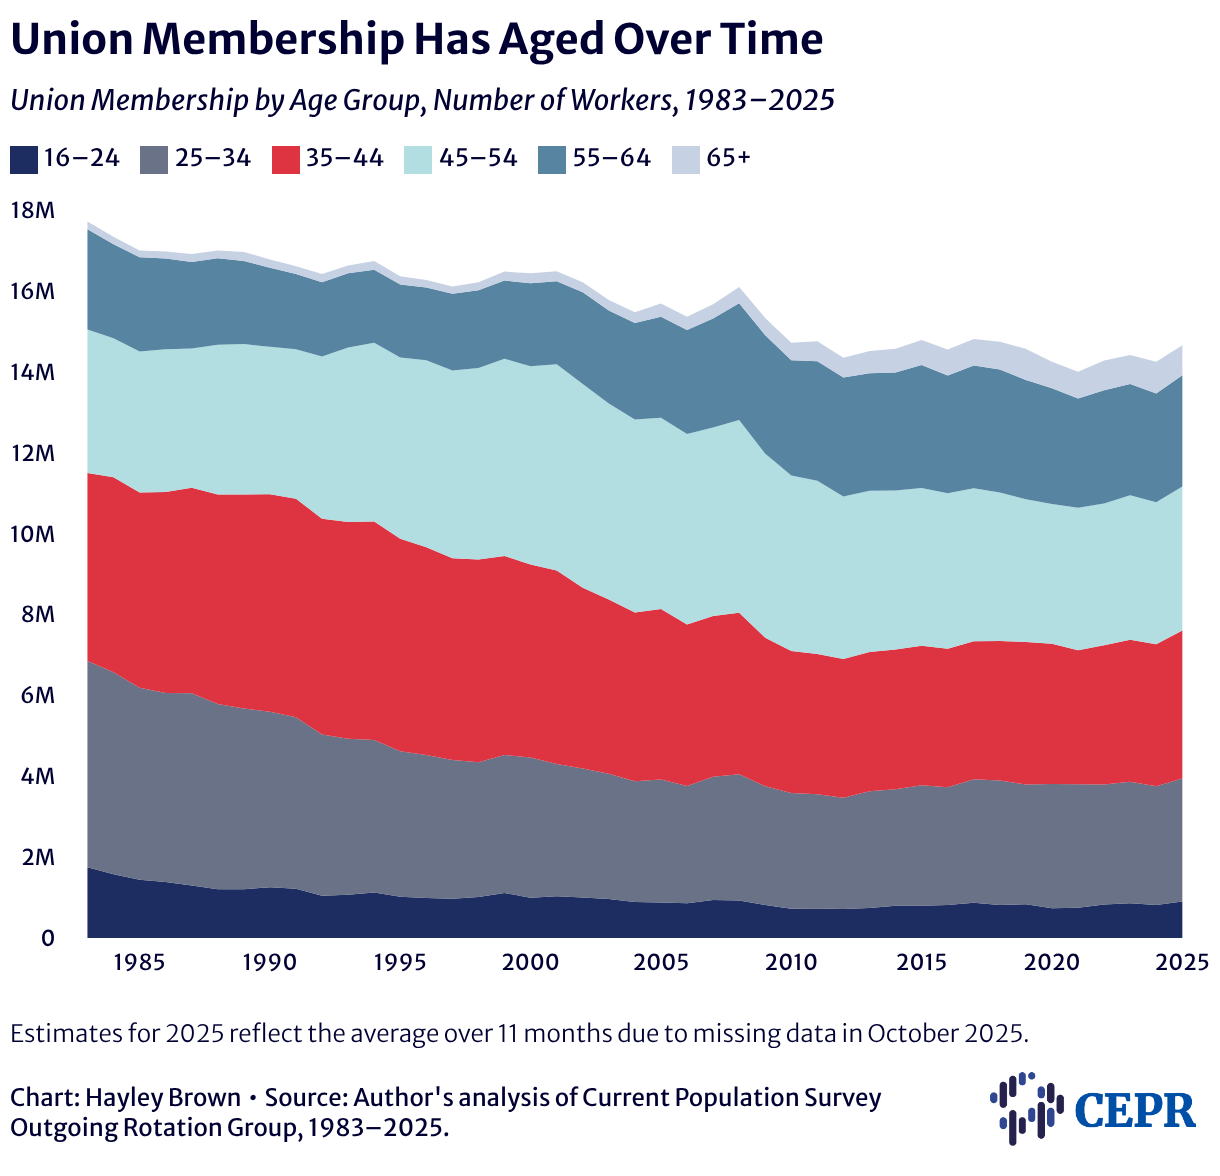
Union Membership Has Aged Over Time
Union Membership by Age Group, Number of Workers, 1983–2025
Stacked area chart showing the number of union members by age group from 1983 to 2025, with each age group distinguished by color. Dark navy represents ages 16–24, medium gray represents ages 25–34, red represents ages 35–44, light teal represents ages 45–54, medium blue represents ages 55–64, and very light gray represents ages 65+. Total union membership declined from roughly 17–18 million in the early 1980s to 14–15 million in 2025. The dark navy and gray areas for younger workers (ages 16–24 and 25–34) steadily shrink over time. In contrast, the light teal, blue, and light gray areas for older workers grow as a share of total membership, with ages 55–64 (medium blue) becoming the largest group by the 2010s.

Estimates for 2025 reflect the average over 11 months due to missing data in October 2025.