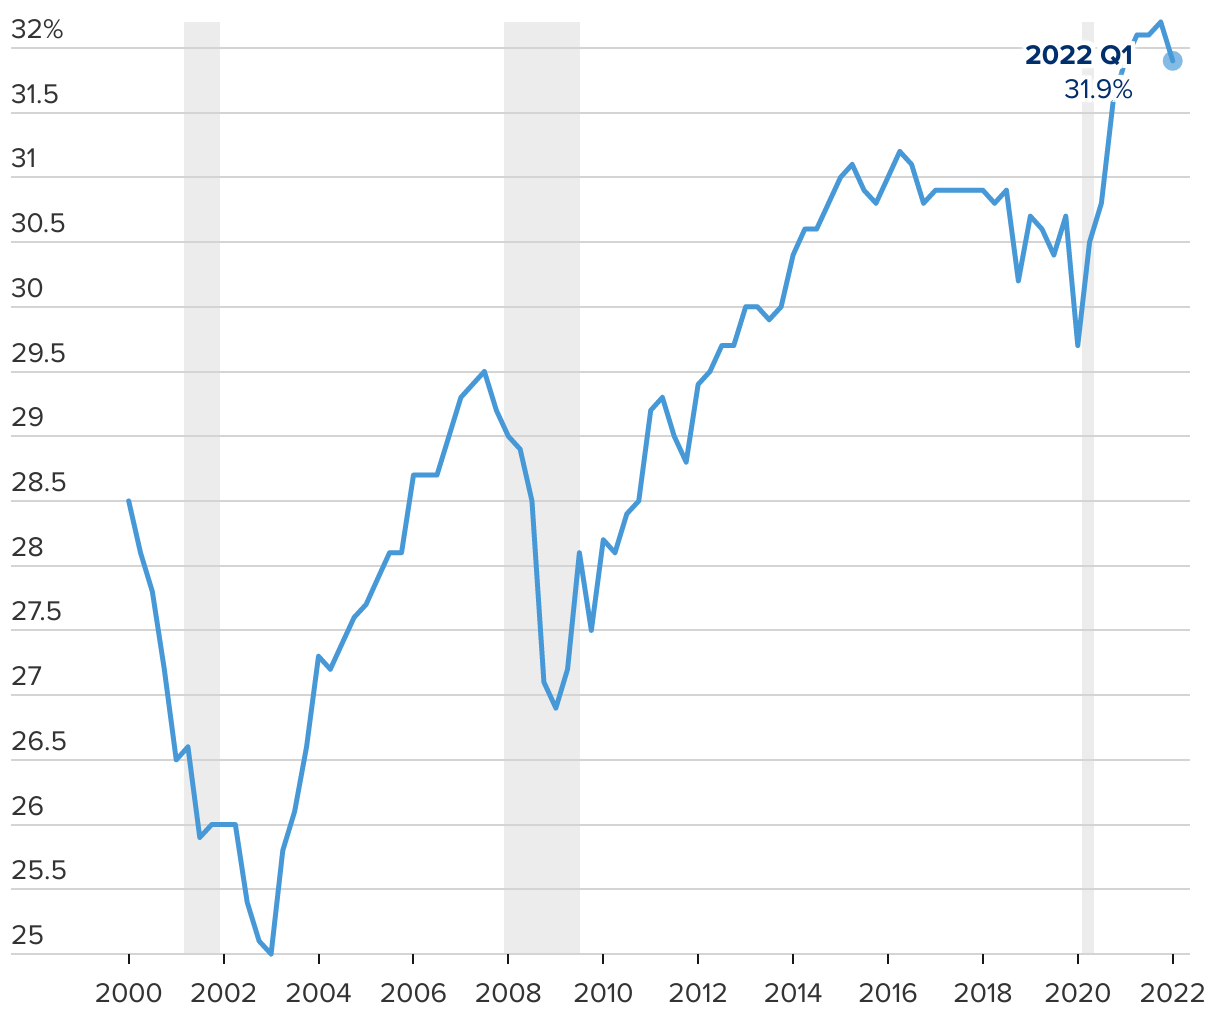
Share of total net worth held by the top 1% in the U.S.
The line chart shows the share of total net worth controlled by the top 1% in the U.S., from Q1 2000 through Q1 2022.
(Please use a modern browser to see the interactive version of this visualization)