Illinois tax volatility among nation's worst over 20 years

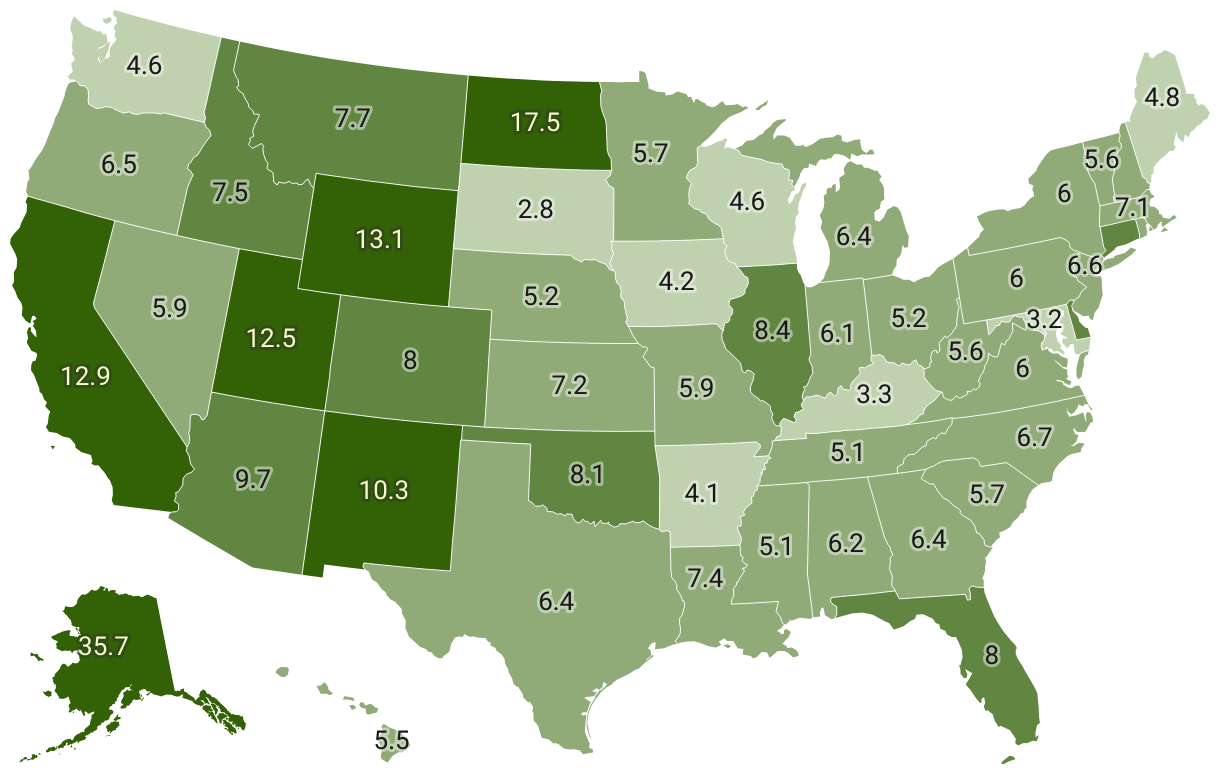
Tax revenue volatility scores for all 50 states, fiscal years 2002-2021. The score for all 50 states was 6.2.

Volatility scores for each state’s overall tax revenue and specific tax sources were calculated using the U.S. Census Bureau’s State Government Tax Collections historical data series from fiscal 2001 to 2021. Data adjusted to control for the effects of tax policy changes using the National Conference of State Legislatures’ State Tax Actions reports for fiscal years 2001 to 2021.
Map: @illinoispolicy Source: The Pew Charitable Trusts