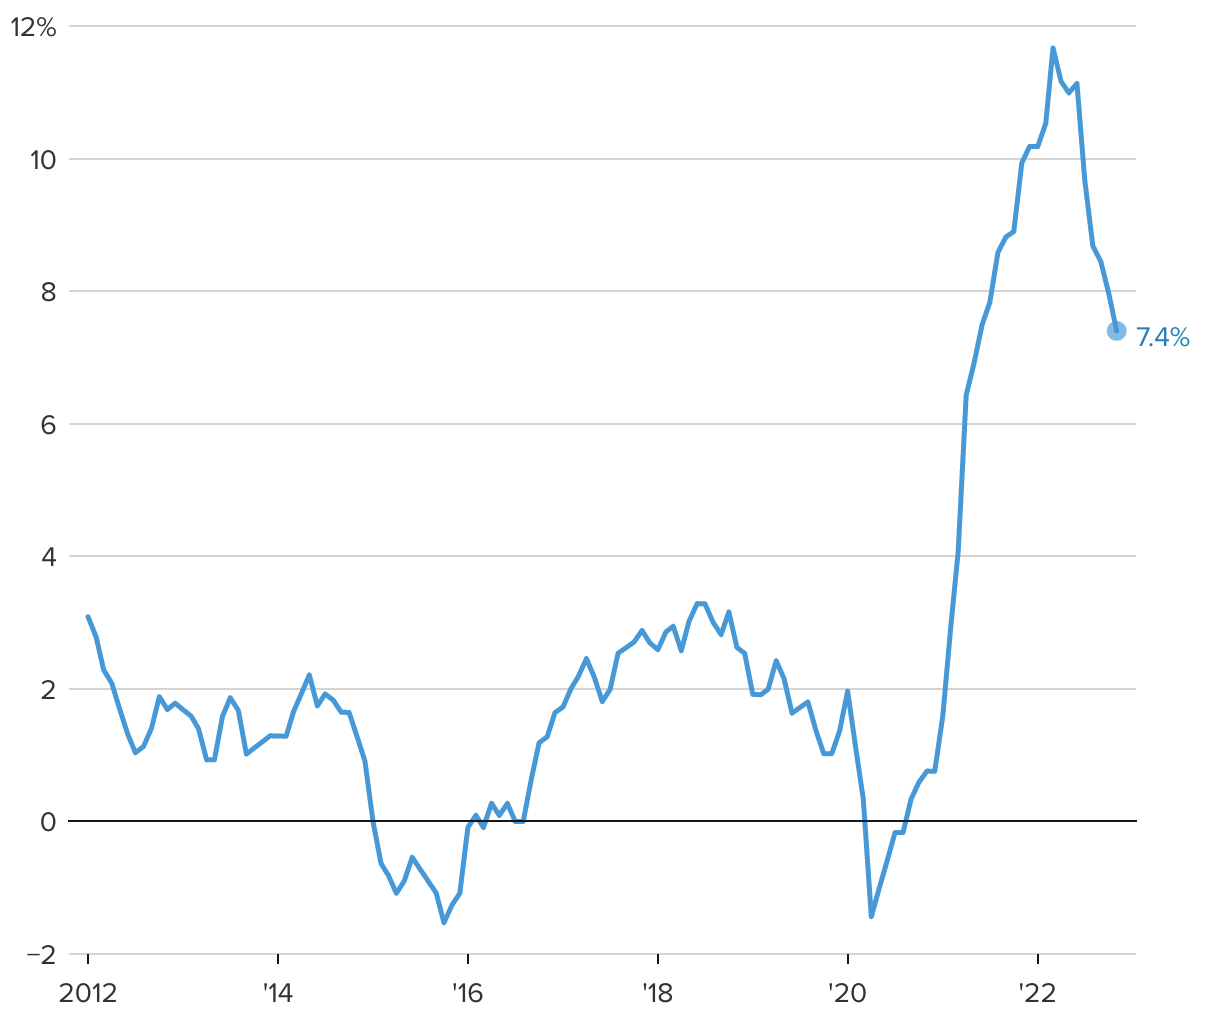
Year-over-year percent change in the producer price index
As of November 2022
The line chart shows the year-over-year percent change in the producer price index published by the U.S. Bureau of Labor Statistics from January 2012 through November 2022.