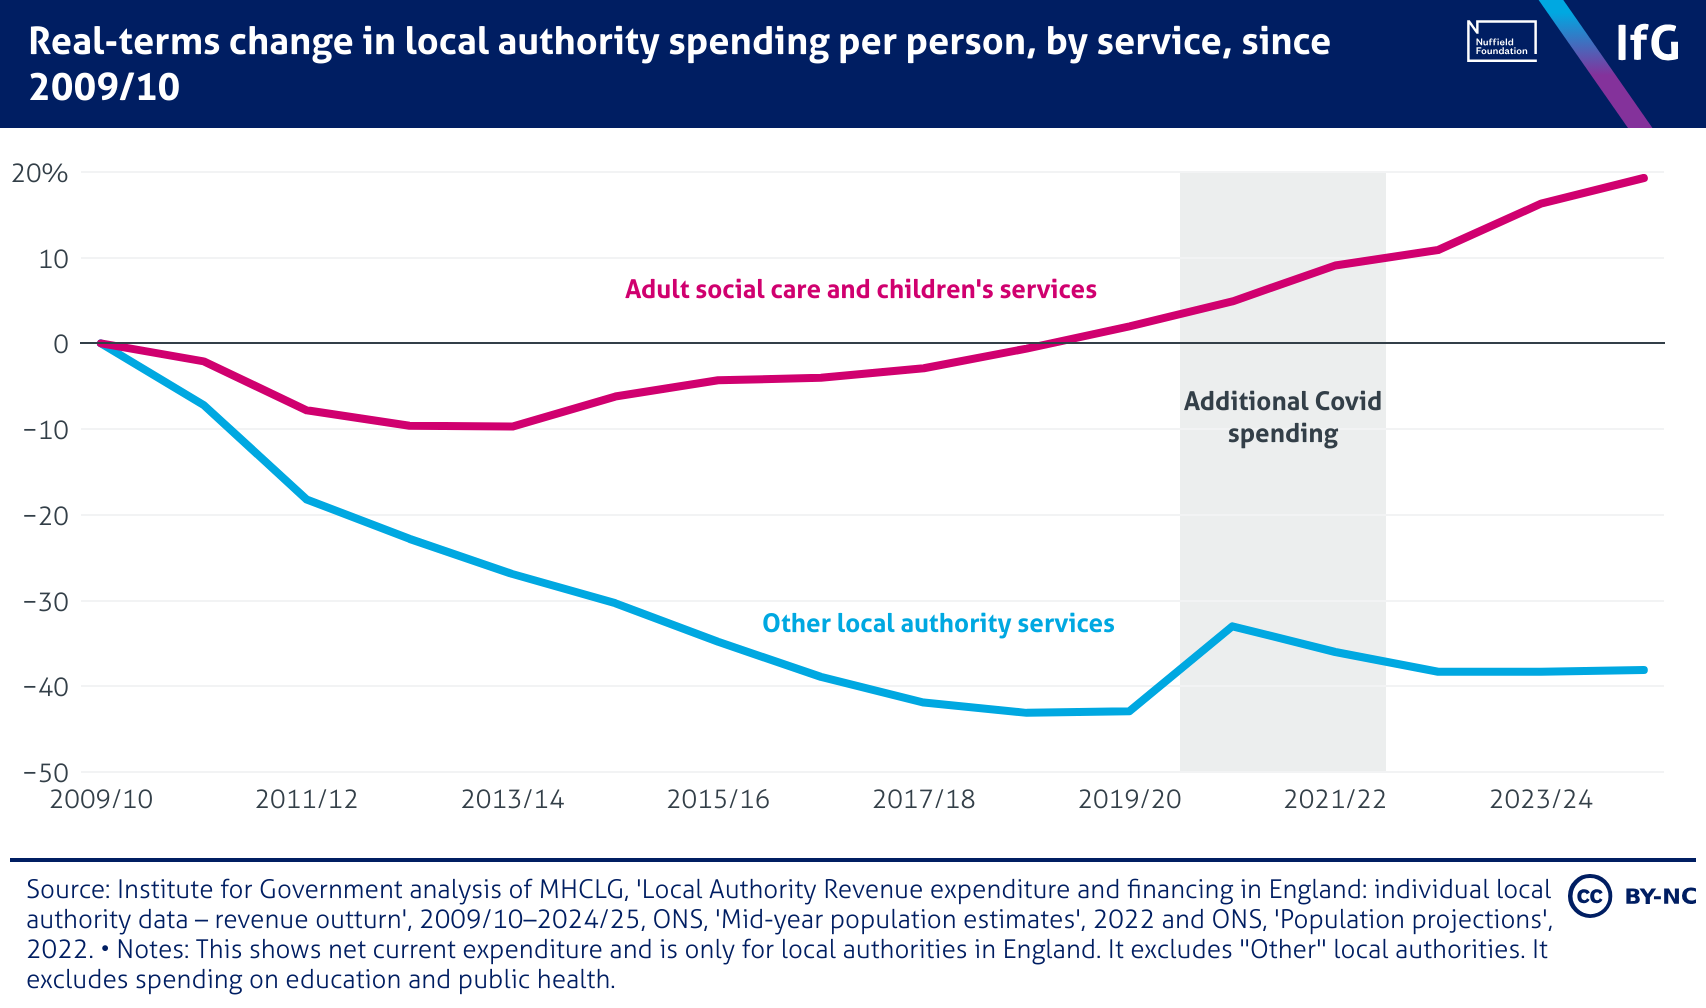
Real-terms change in local authority spending per person, by service, since 2009/10

A line chart from the Institute for Government of real-terms change in local authority spending per person, by service, since 2009/10, where spending on adult social care and children's services is almost 20% higher than it was in 2009/10, while spending on other local authority services fell by nearly 40%.

