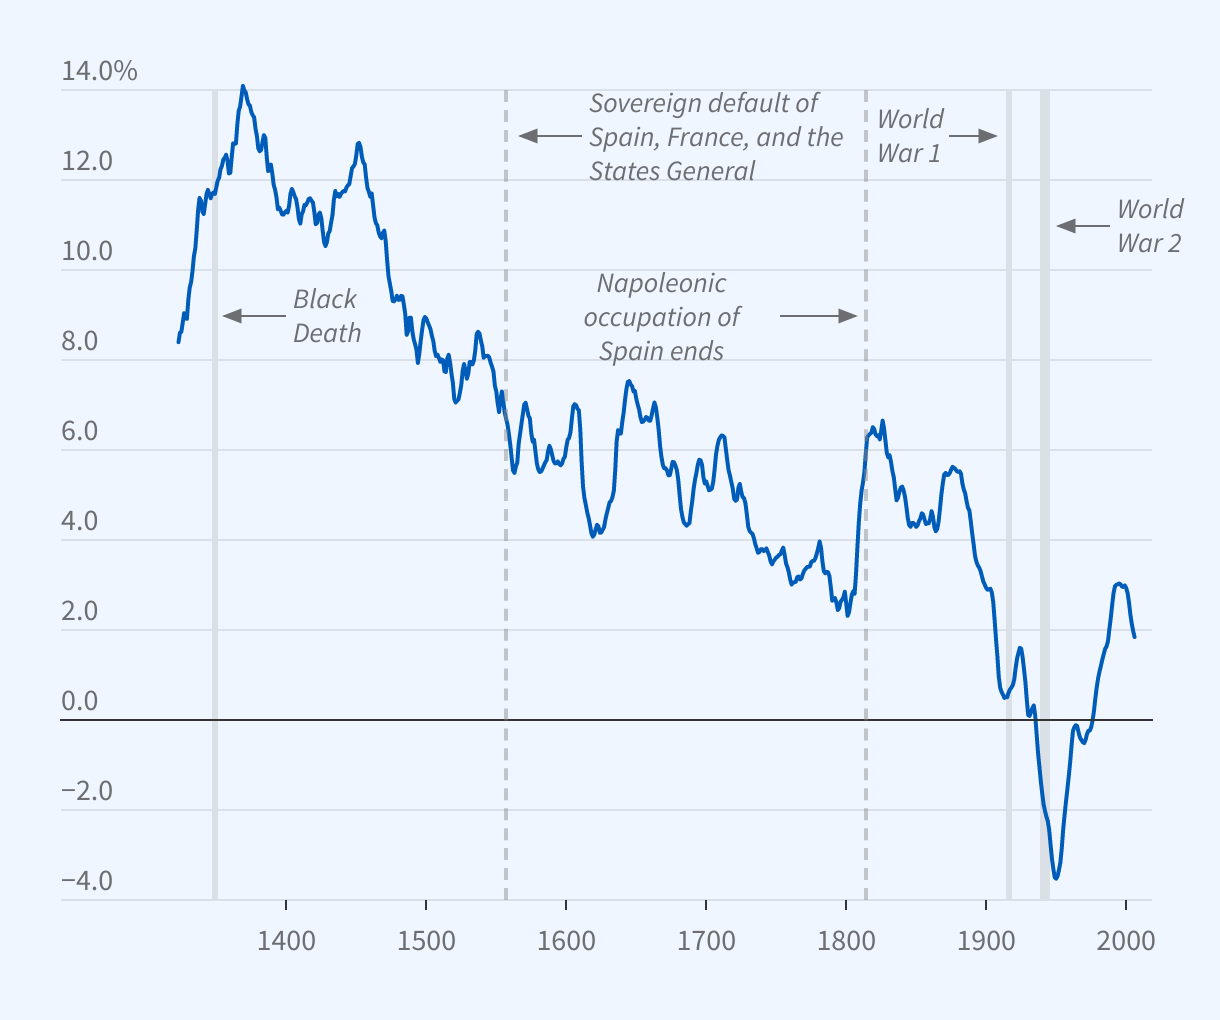
Filtered Long-Run Trend in the Global Real Interest Rate
The graph is a line chart titled "Long-Run Trend in the Global Real Interest Rate."
The y-axis, which ranges from -4 to 14 percent, plots the researchers’ estimate of the long-run trend in the global real interest rate. The x-axis ranges from 1323 to 2006.
Over the past seven centuries, the trend series has declined: in 1323, the real rate was 8.4 percent; in 2006, it was 1.8 percent.
Source: P. Schmelzing, "Eight centuries of global real rates, R-G, and the 'suprasecular' decline, 1311-2018," Bank of England Staff Working Paper 845, and Rogoff, Rossi, and Schmelzing (2022)