A Majority Back the Schedules That Work Act
Share of likely voters who support or oppose the proposed Schedules That Work Act
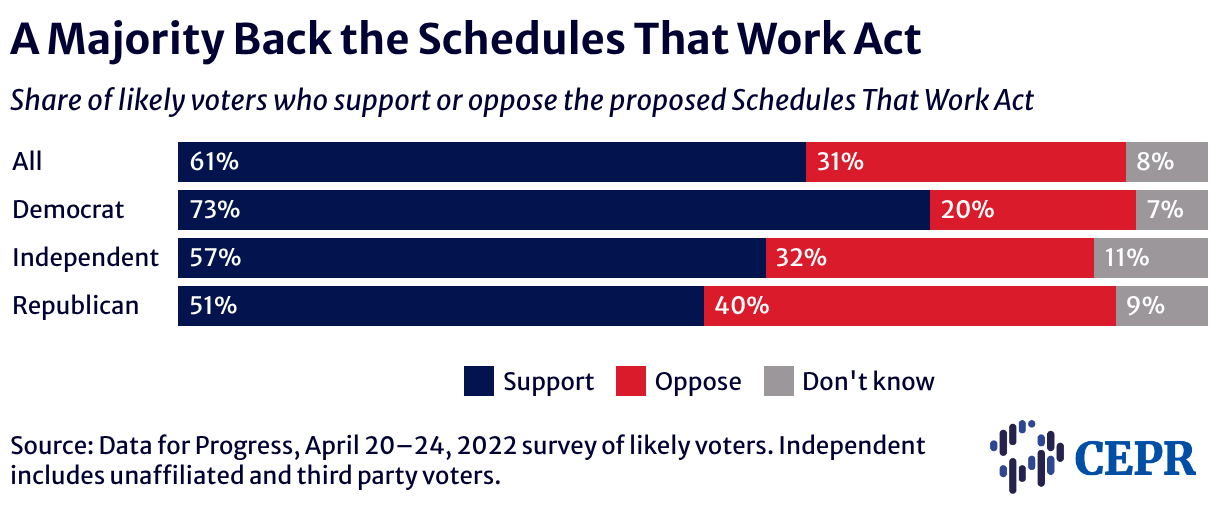
A stacked bar chart showing the share of respondents who support (dark blue), oppose (red), or are unsure about (grey) the proposed Schedules That Work Act, broken out by political affiliation. 61 percent of all voters, 73 percent of Democrats, 57 percent of independents, and 51 percent of Republicans support the goals of the law.

Support
Oppose
Don't know