Average NAPLAN scores 2025
When comparing scores across geographical areas, a clear pattern emerges: the further from the city, the lower the average score. This is reflected across all year levels and subjects tested.
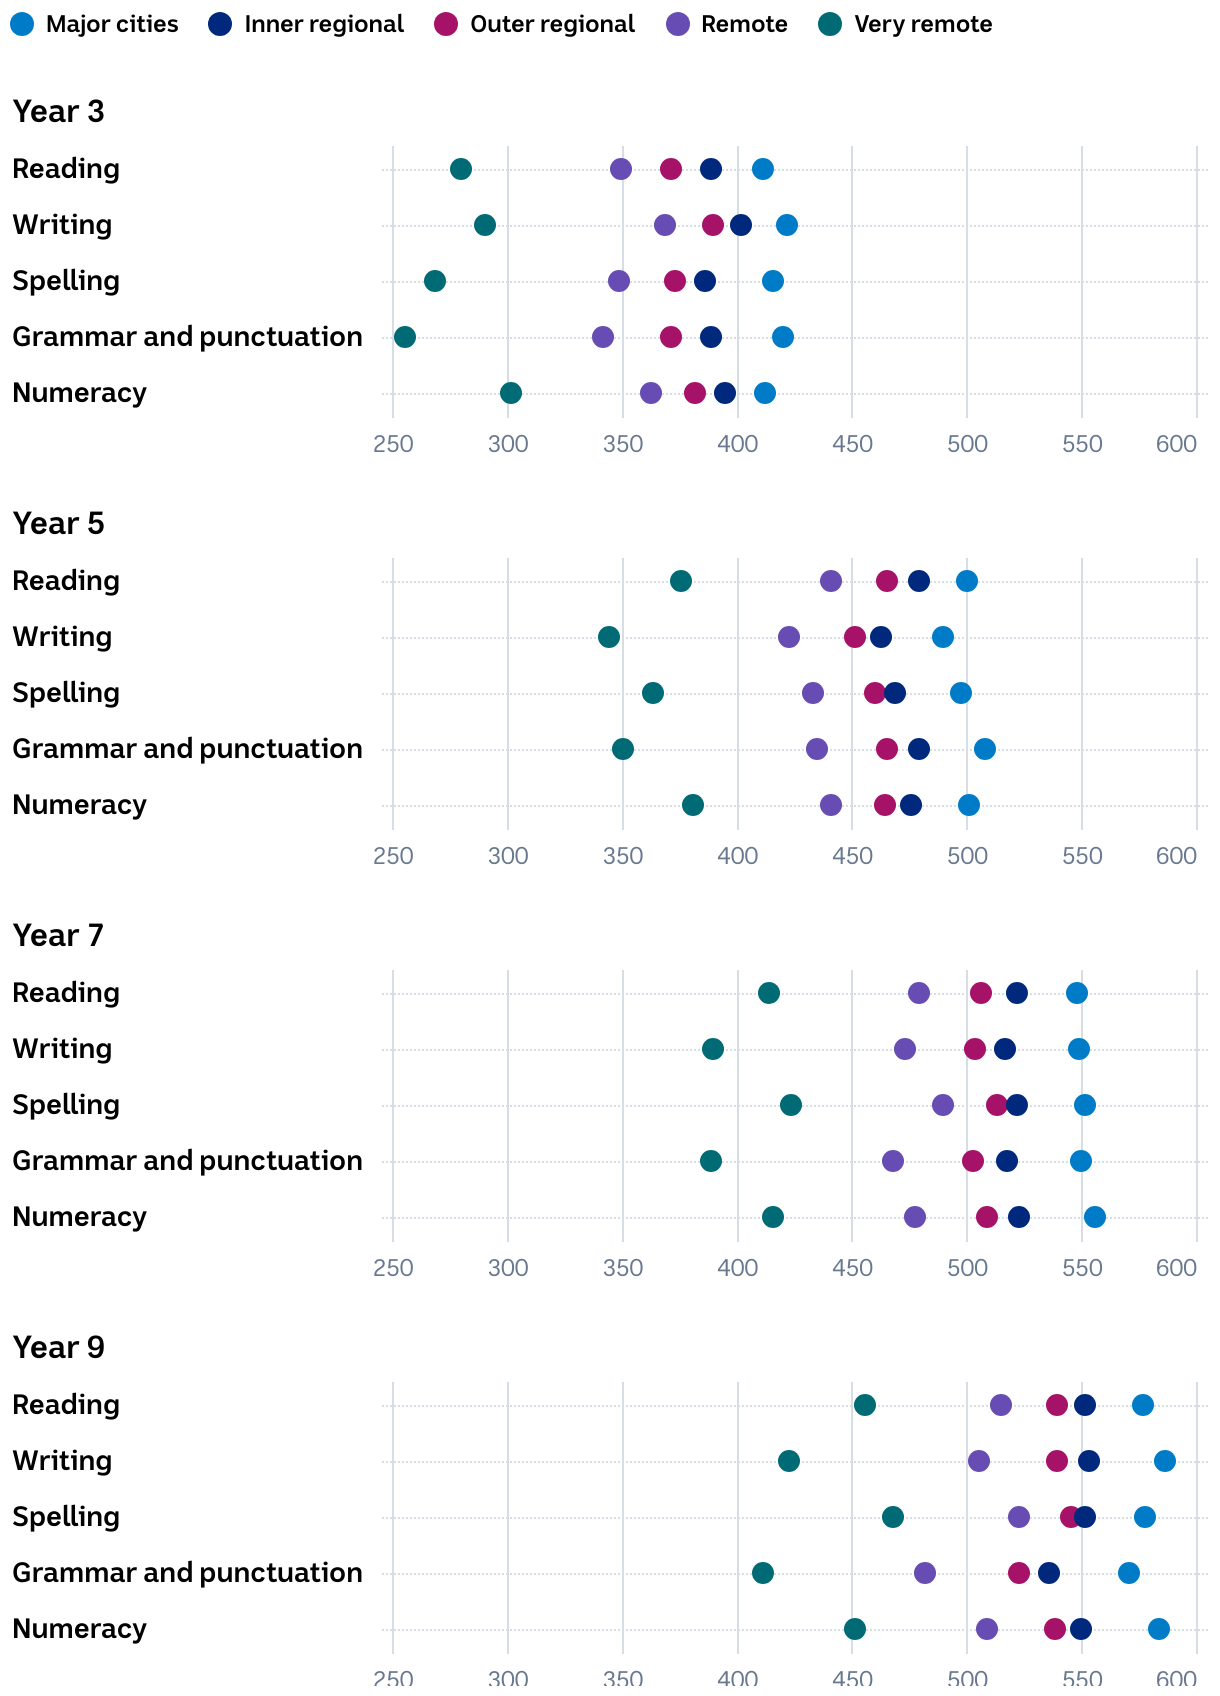
A dot plot shows the average NAPLAN scores for years 3, 5, 7 and 9 in reading, writing, spelling, grammar and punctuation, and numeracy, for 2025. The dot plots are grouped by year level, and colour-coded to represent different geographical groups: major cities, inner regional, outer regional, remote and very remote. A clear pattern emerges: across every year level and subject, the average scores are lower the further from the city, so major cities' average scores are at the higher end while very remote average scores are at the lower end.