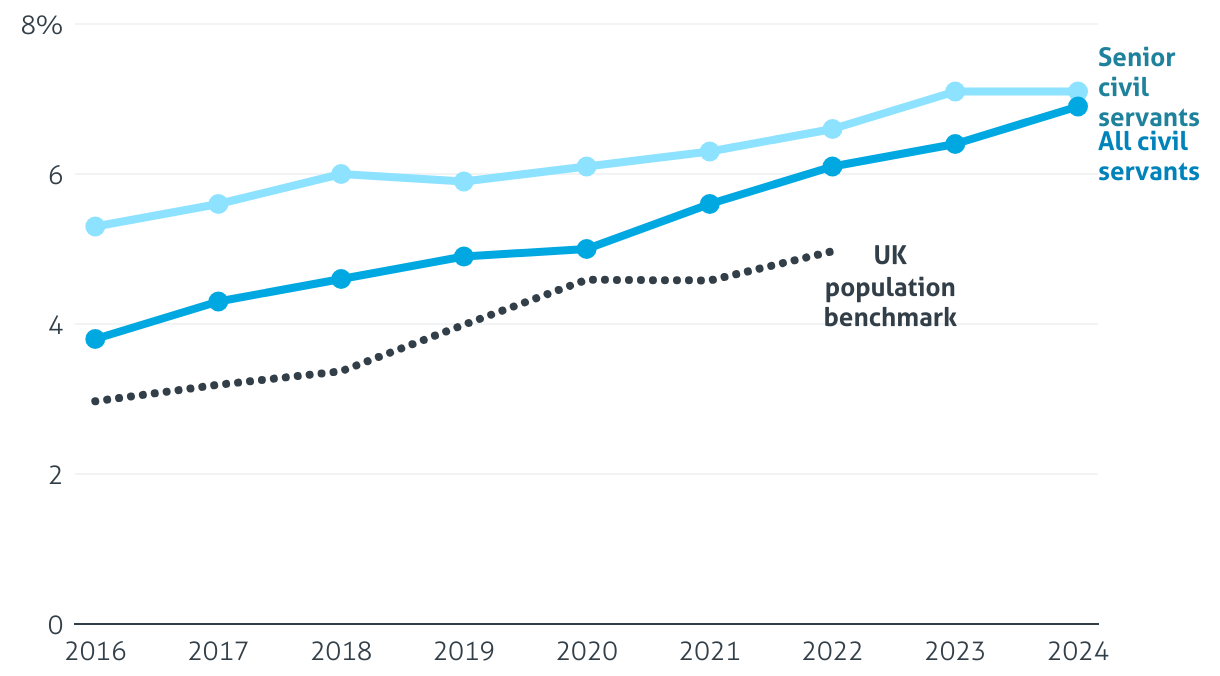
LGB+ civil servants, 2016–24
A line chart from the Institute for Government showing LGB+ staff in the civil service, 2016-24, showing that the share of LGB+ staff is higher in the senior civil service than in the whole civil service throughout the entire period.
