•
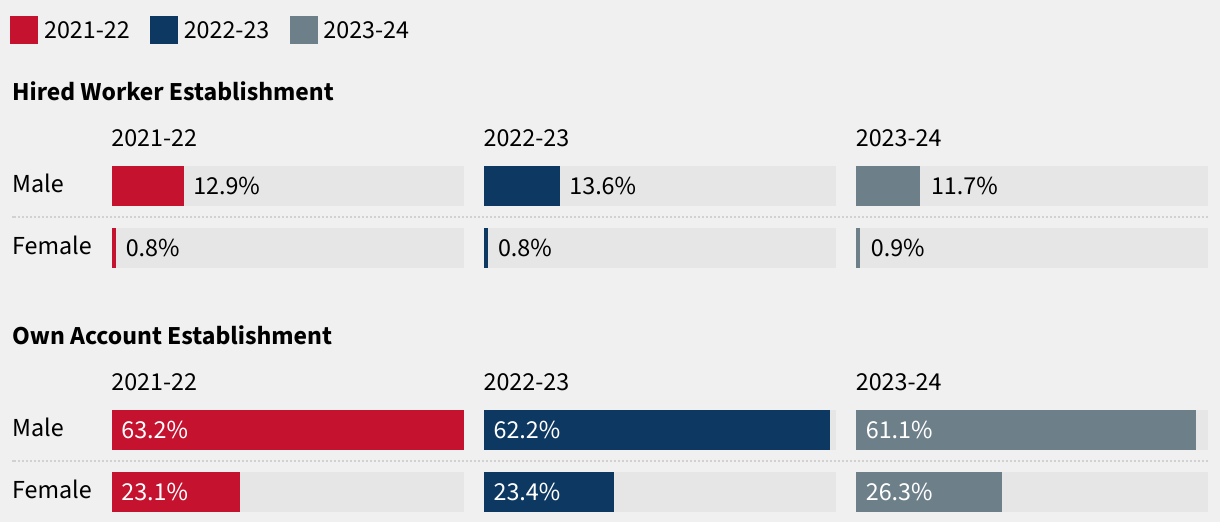
FIGURE
4
Distribution of non-agricultural unincorporated establishments by gender and establishment type (2021–2023)
(Please use a modern browser to see the interactive version of this visualization)