Metropolitan Multifamily Insurance Costs Per Unit
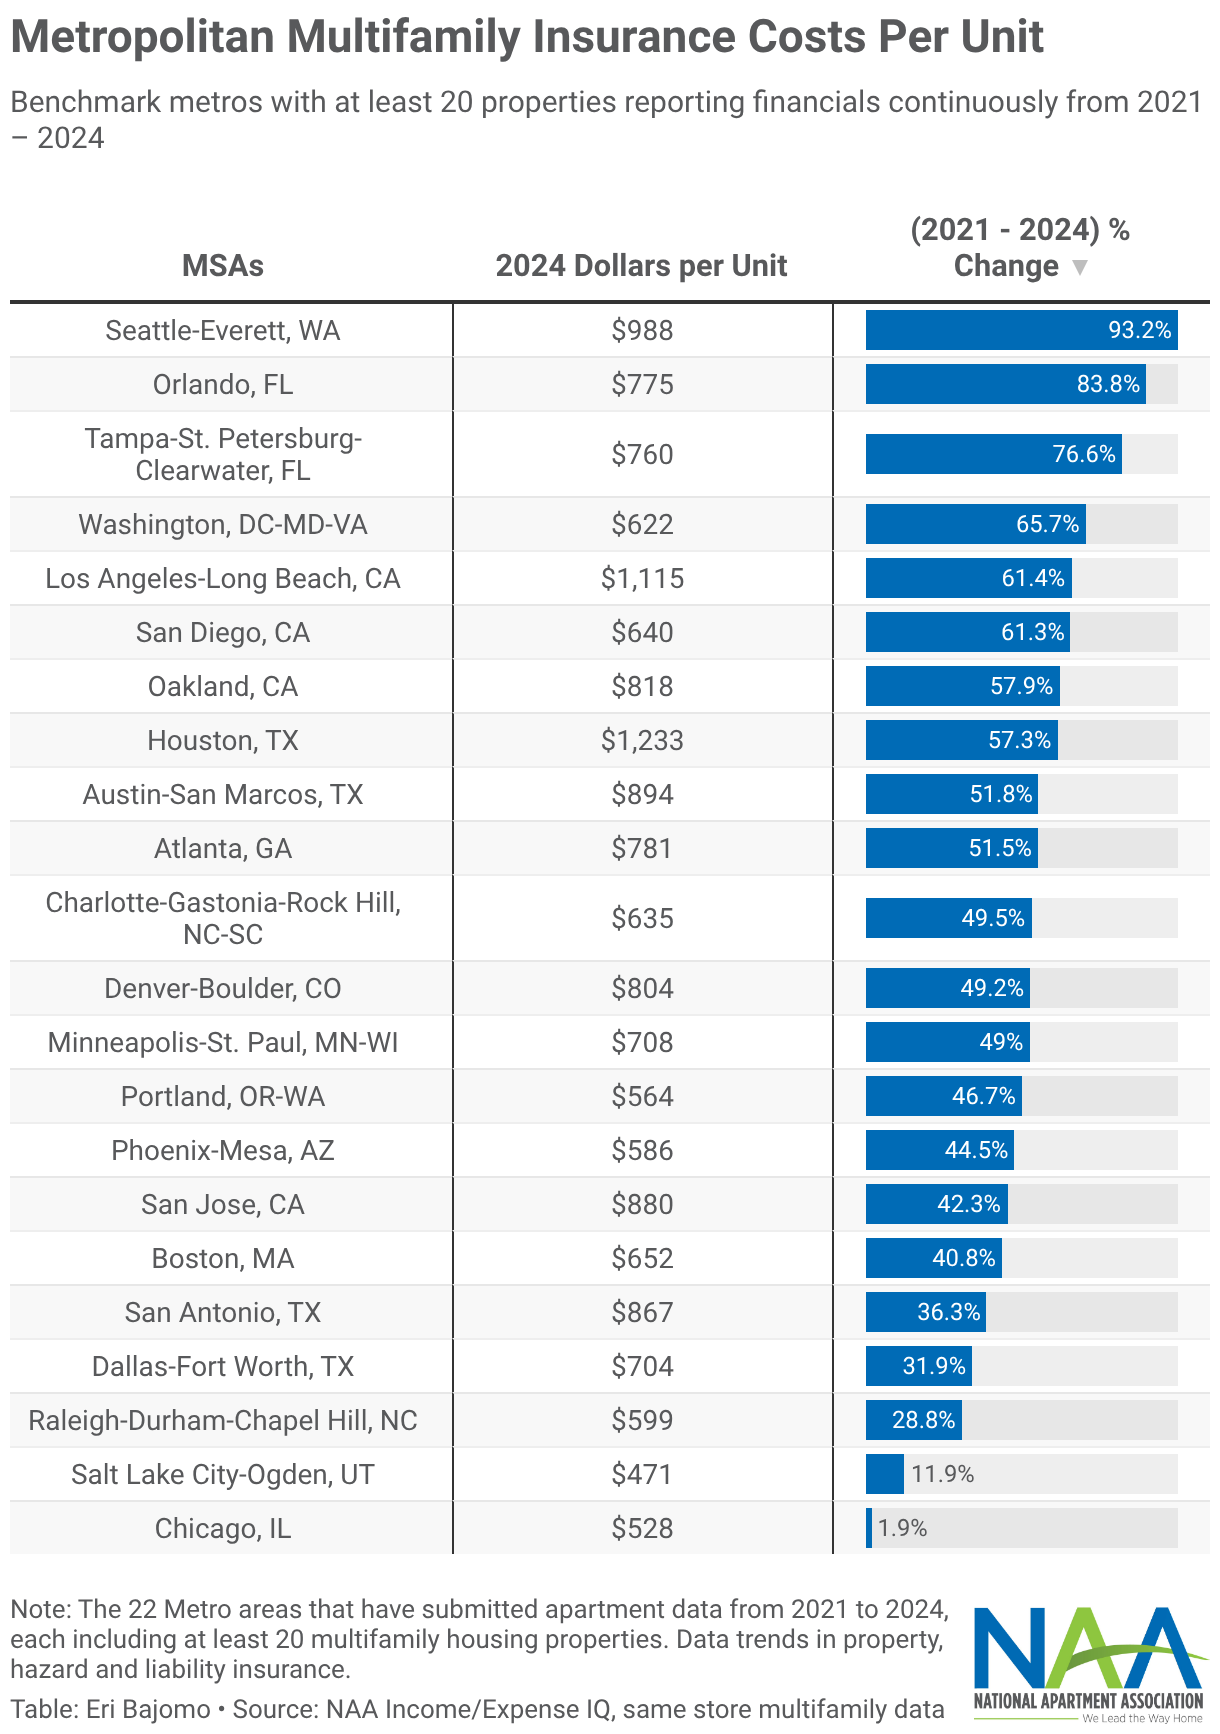
Benchmark metros with at least 20 properties reporting financials continuously from 2021 – 2024
Table comparing metropolitan multifamily average insurance cost per unit across select markets in 2024. The table also shows percentage changes in insurance costs from 2021 to 2024, illustrating varying rates of insurance expense growth across metropolitan areas.