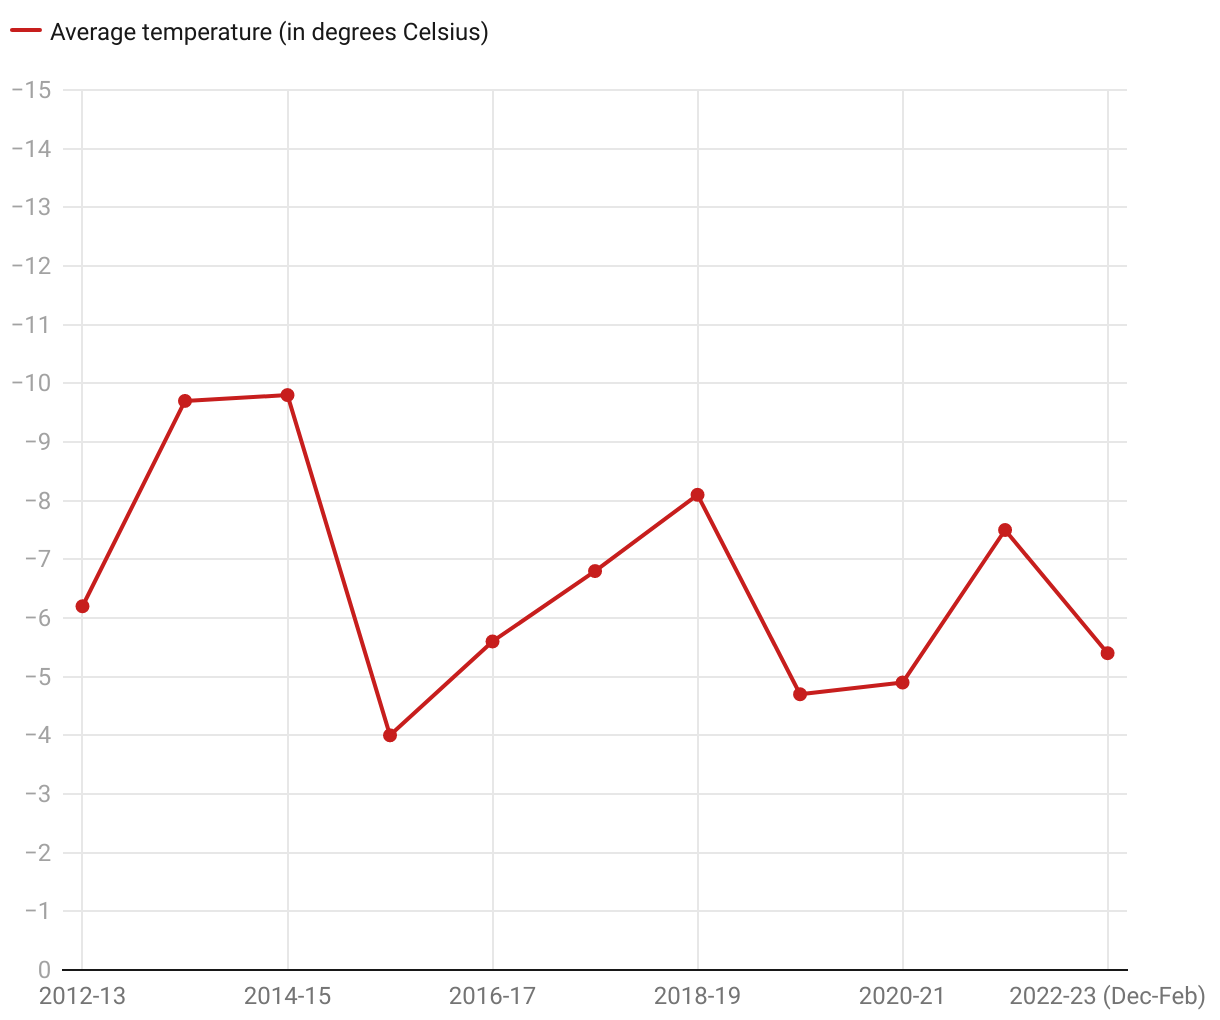
Average Dec.-Mar. temperatures by season
Line graph showing average December to March temperatures for every canal season from 2012-13 to now. Seasons have become somewhat warmer in general, with some outliers. The coldest seasons in the last 5 years are warmer than those 10 years ago.