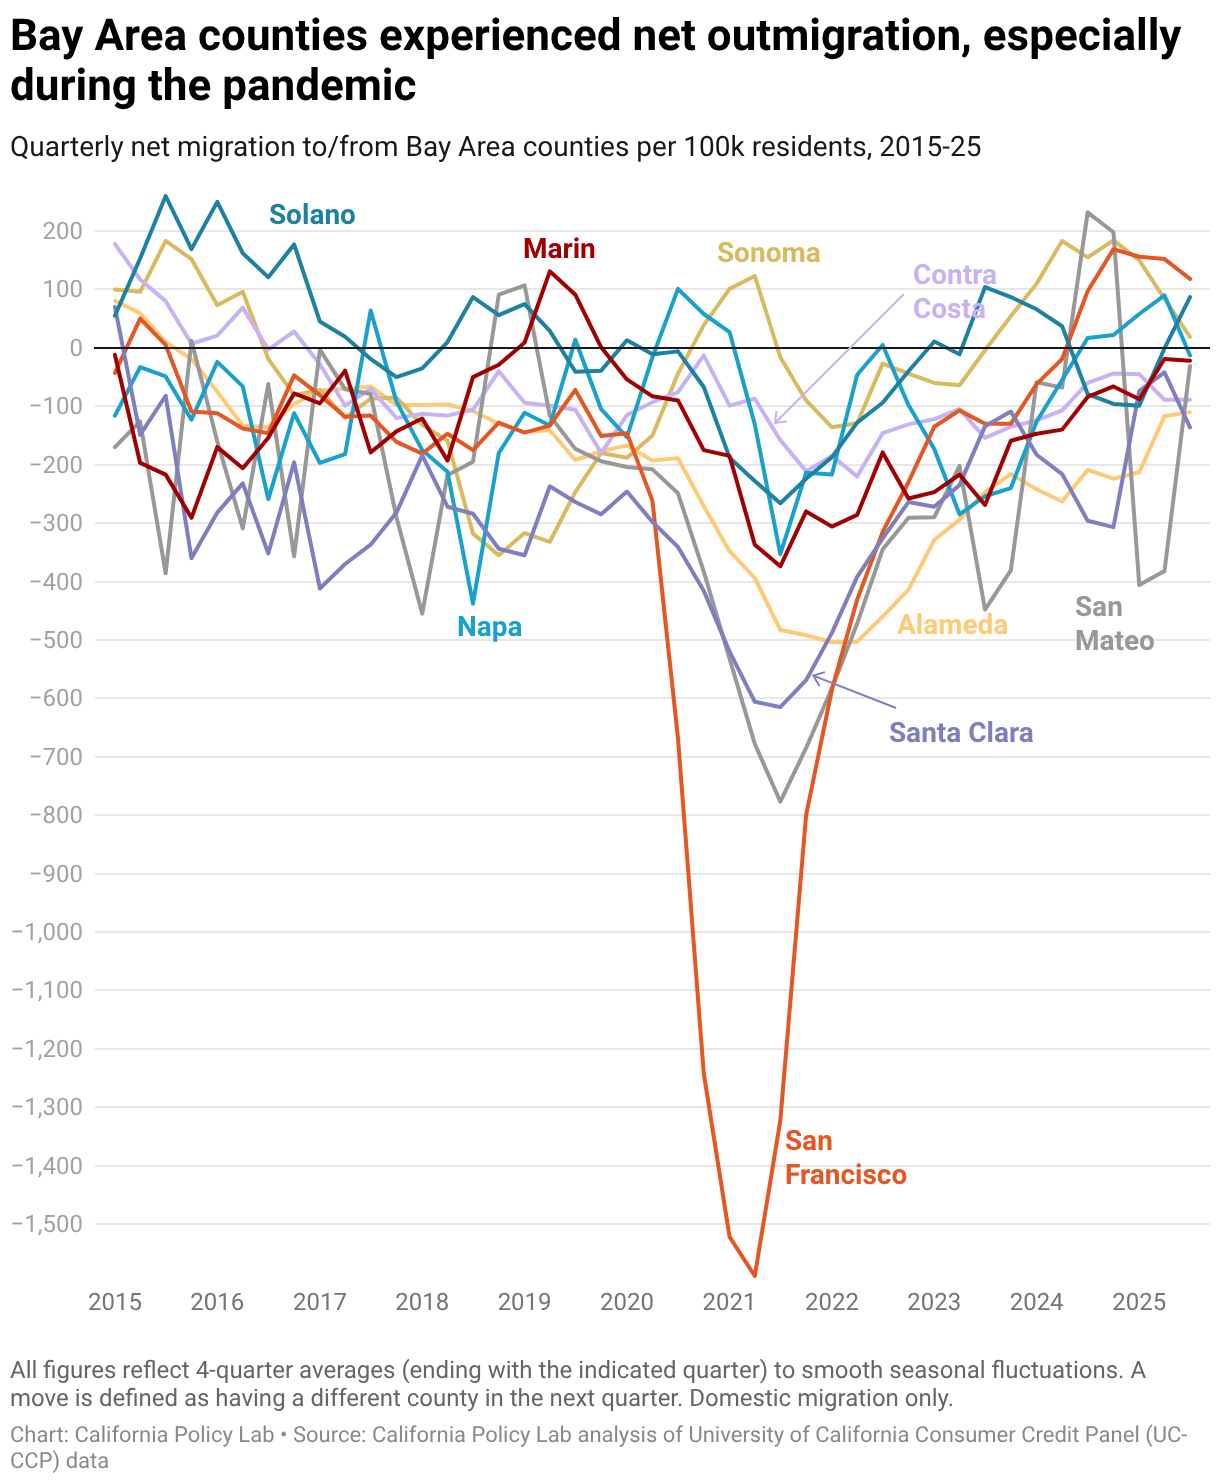
Bay Area counties experienced net outmigration, especially during the pandemic
Quarterly net migration to/from Bay Area counties per 100k residents, 2015-25
Multi-line chart tracking quarterly net migration per 100,000 residents for nine Bay Area counties, 2015–2025. San Francisco shows a dramatic dip to about -1,400 around 2021, far deeper than any other county, followed by a sharp recovery toward positive territory by 2024–2025. Alameda and Santa Clara also dip substantially during the pandemic. Solano and Contra Costa stay closest to positive/neutral throughout.