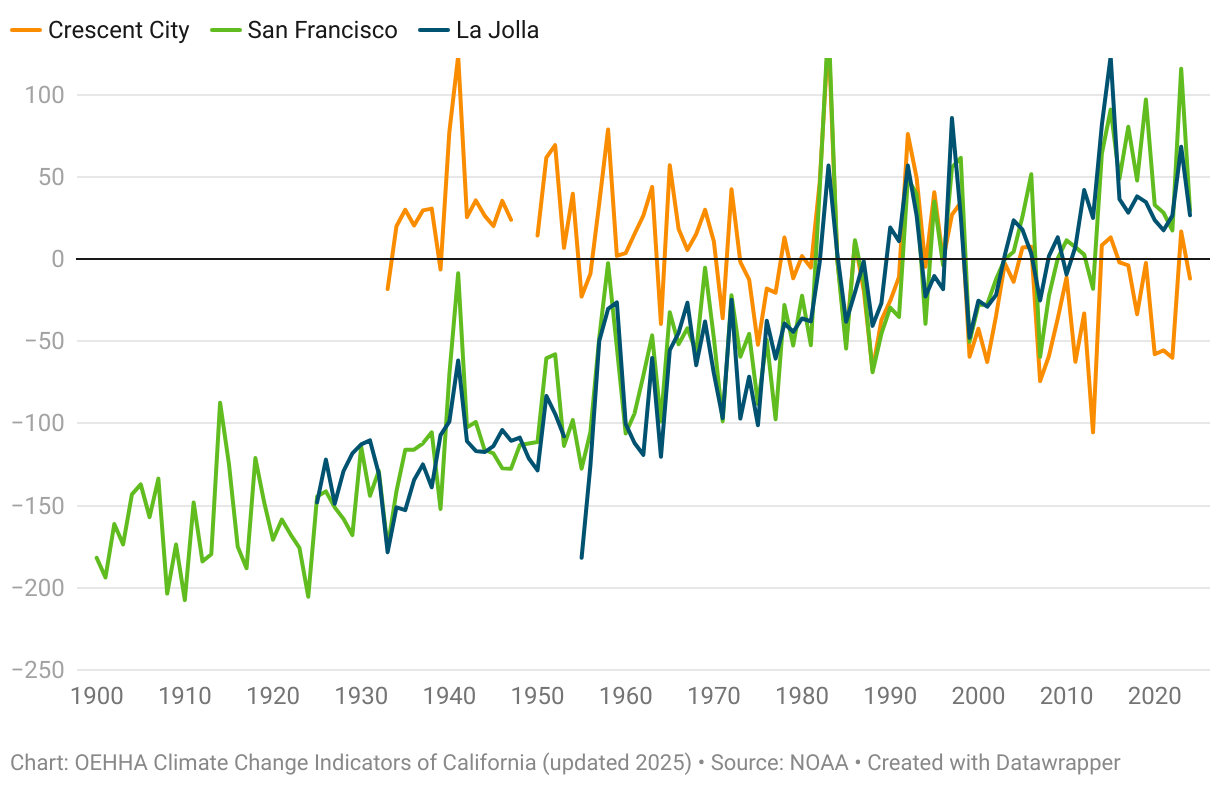
This graph shows the relative change, in millimeters, of sea levels at San Francisco (1900-2024), La Jolla (1925-2024), and Crescent City (1933-2024). Sea levels at San Francisco and La Jolla are rising, while Crescent City is declining.
(Please use a modern browser to see the interactive version of this visualization)
