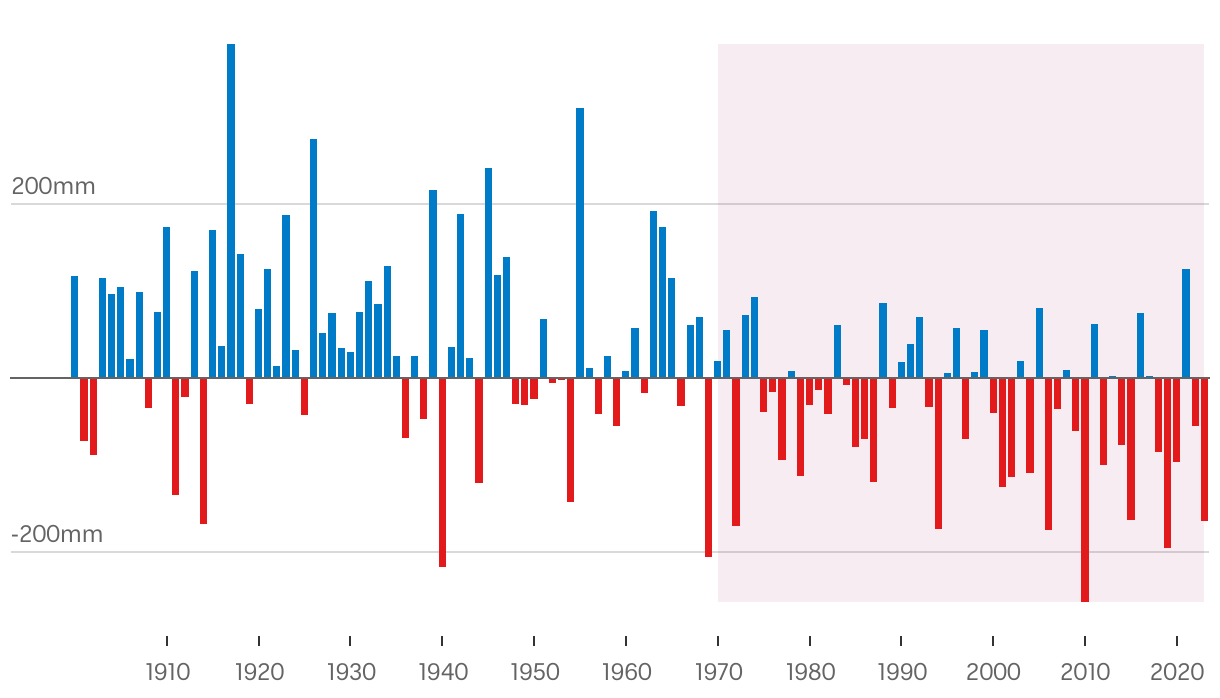
A line chart representing the deviation from average rainfall every year from 1900 showing a downwards trend.
(Please use a modern browser to see the interactive version of this visualization)