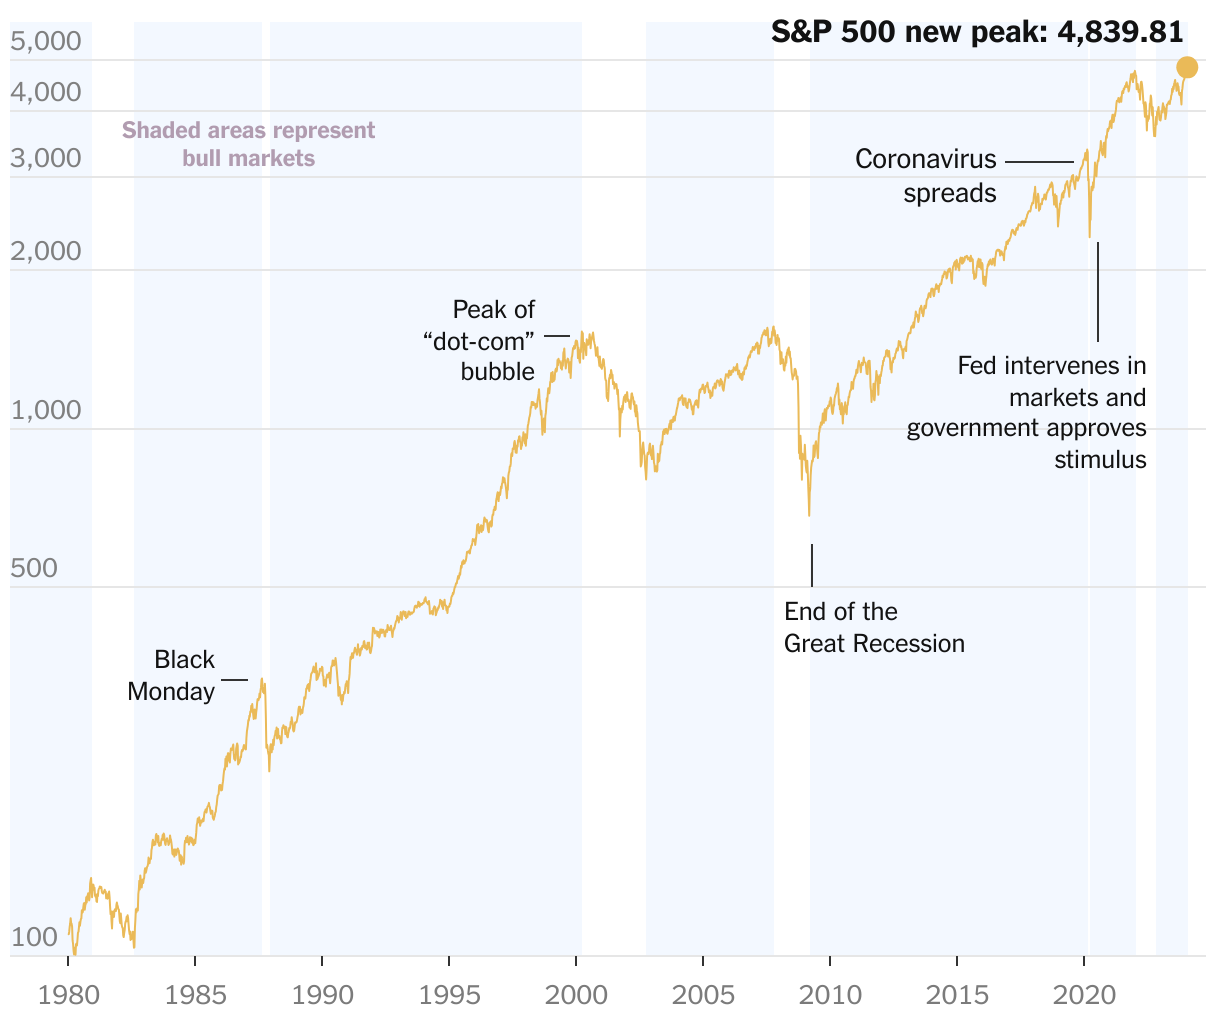
The S&P 500 plotted weekly. The vertical scale is adjusted to show comparable percentage changes.
A line chart showing the trajectory of the S&P 500 index from 1980 to now. The index has reached a new peak.
The S&P 500 plotted weekly. The vertical scale is adjusted to show comparable percentage changes.