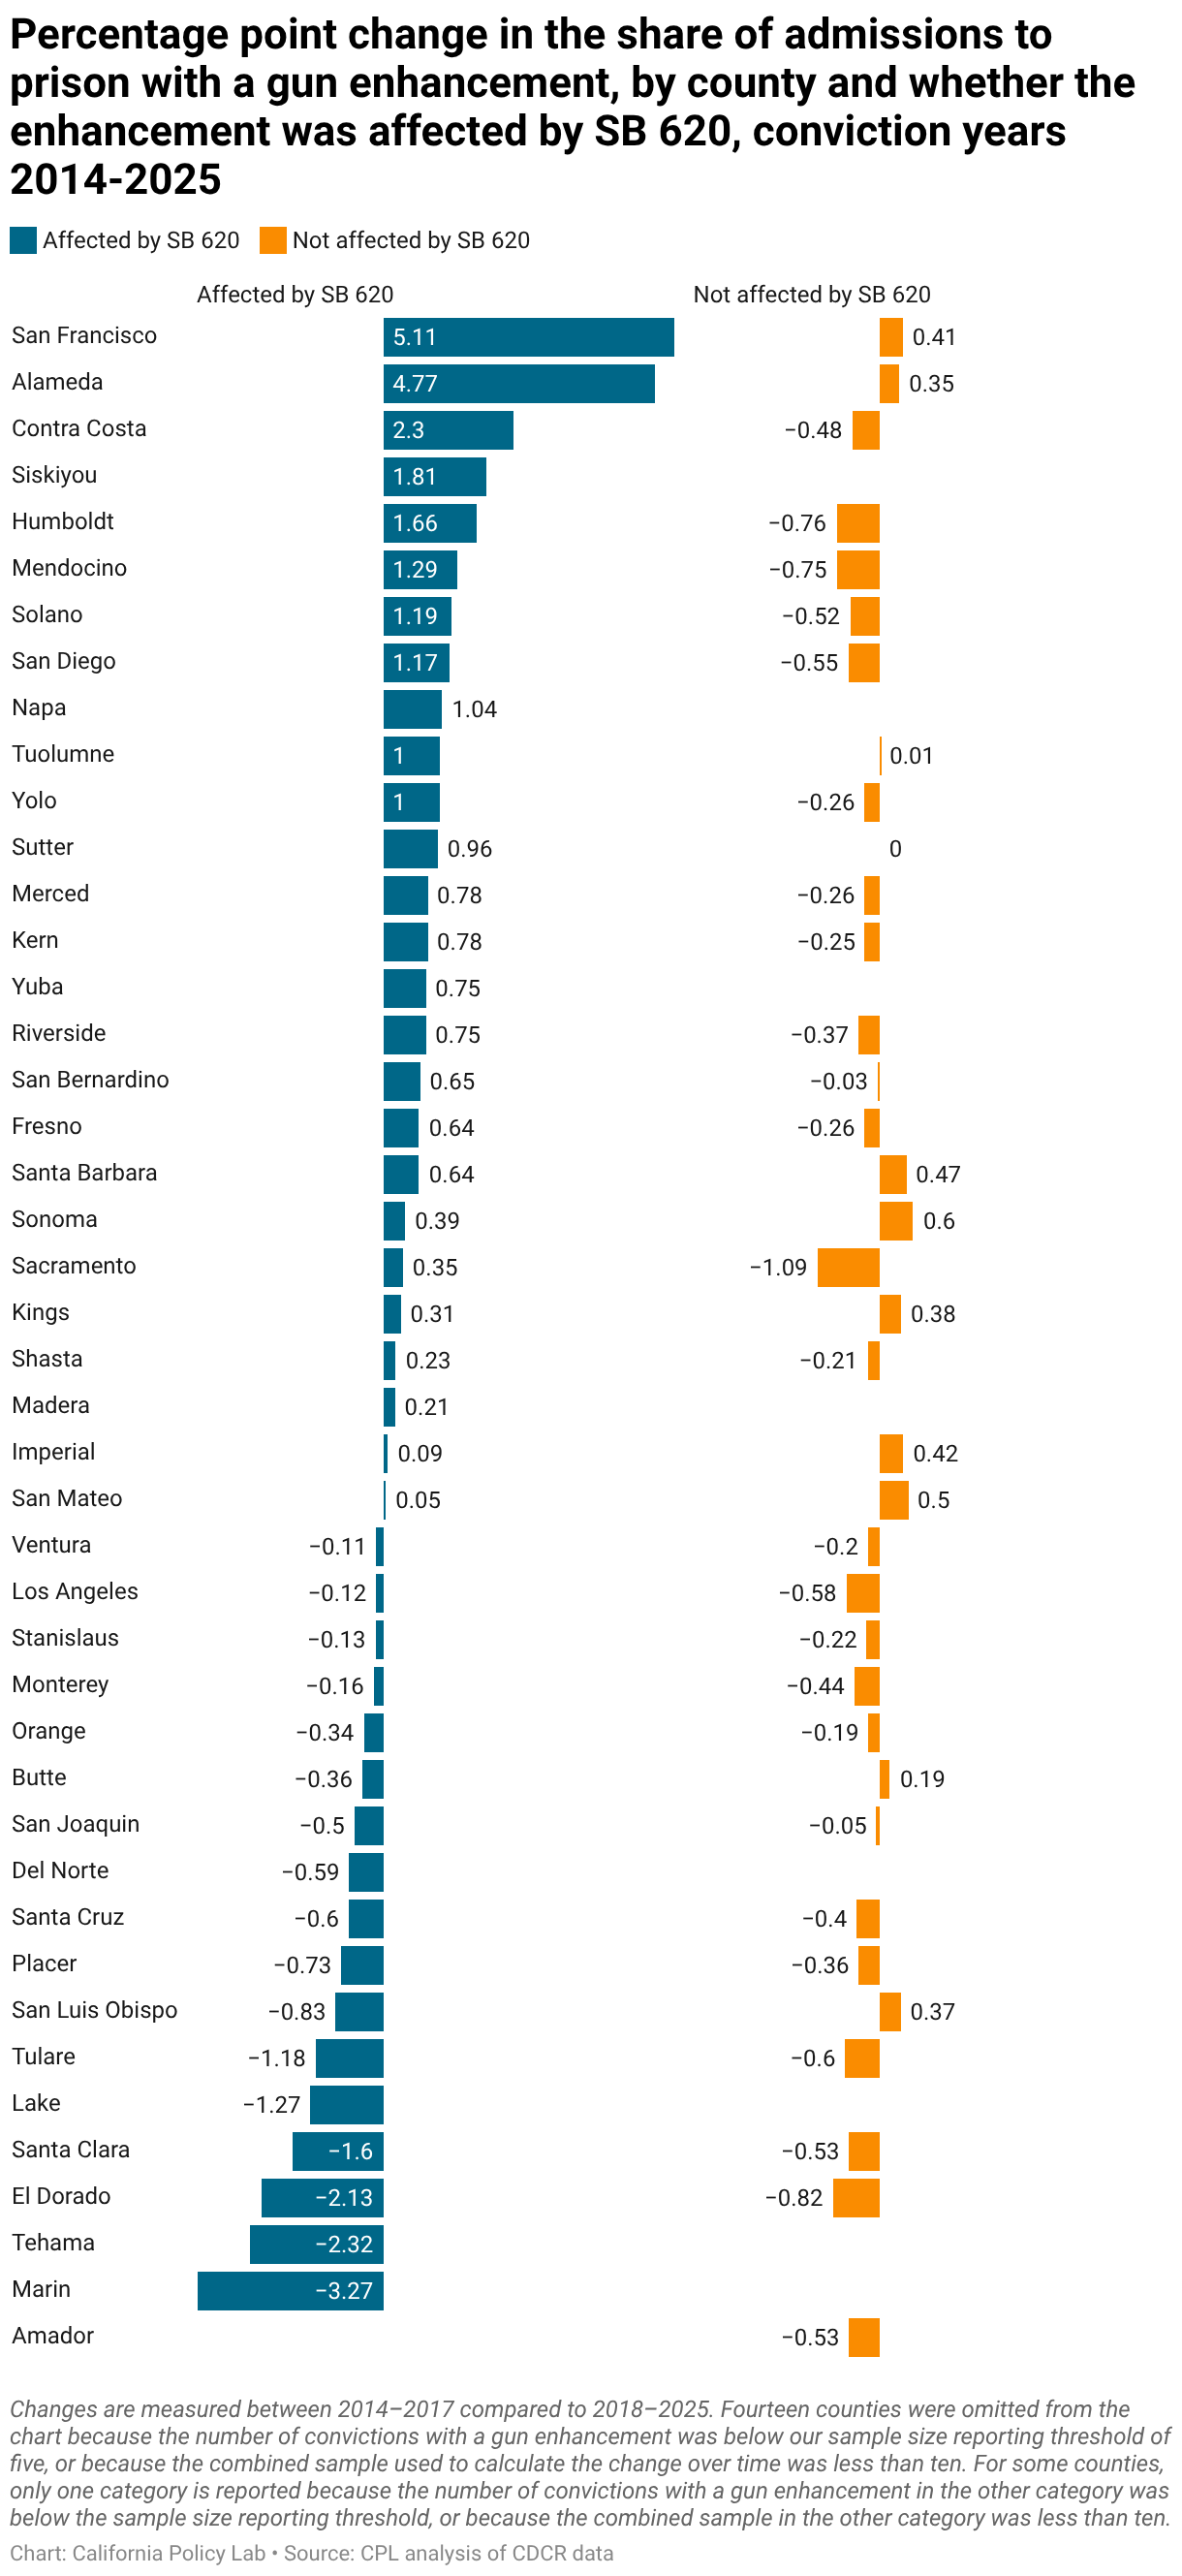
Percentage point change in the share of admissions to prison with a gun enhancement, by county and whether the enhancement was affected by SB 620, conviction years 2014-2025
This dual horizontal bar chart shows the percentage point change in the share of prison admissions with a gun enhancement "Affected by SB 620" (dark blue) and "Not affected by SB 620" (orange) across various California counties for conviction years 2014-2025.
San Francisco and Alameda show the largest positive percentage point increases in the "Affected" category at +5.11 and +4.77 respectively. Conversely, Marin (-3.27), Tehama (-2.32), and El Dorado (-2.13) show the largest decreases in the same category. For the "Not affected" category, most counties saw minor changes, though Sacramento showed a notable decrease of -1.09 percentage points. A note indicates that changes are measured between 2014–2017 and 2018–2025, and some counties are omitted due to small sample sizes.
