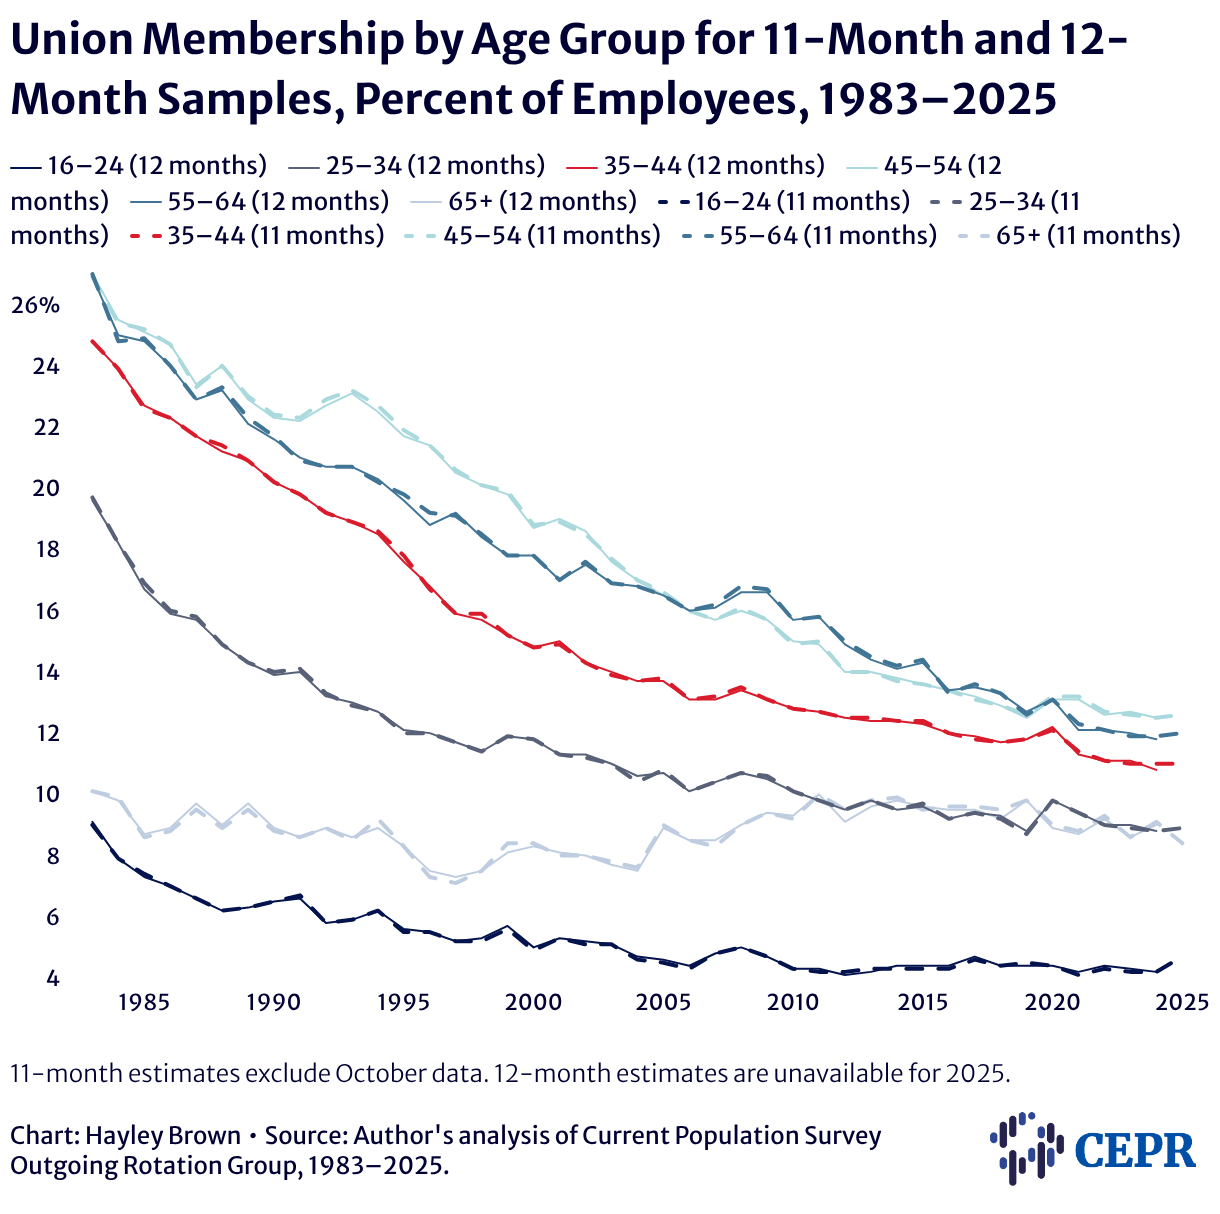
Union Membership by Age Group for 11-Month and 12-Month Samples, Percent of Employees, 1983–2025
Line chart comparing union membership rates by age using 12-month (solid) and 11-month (dashed) samples from 1983 to 2025. Younger workers are shown in darker blues, older groups in lighter blues and red tones. Trends are similar across samples.

11-month estimates exclude October data. 12-month estimates are unavailable for 2025.