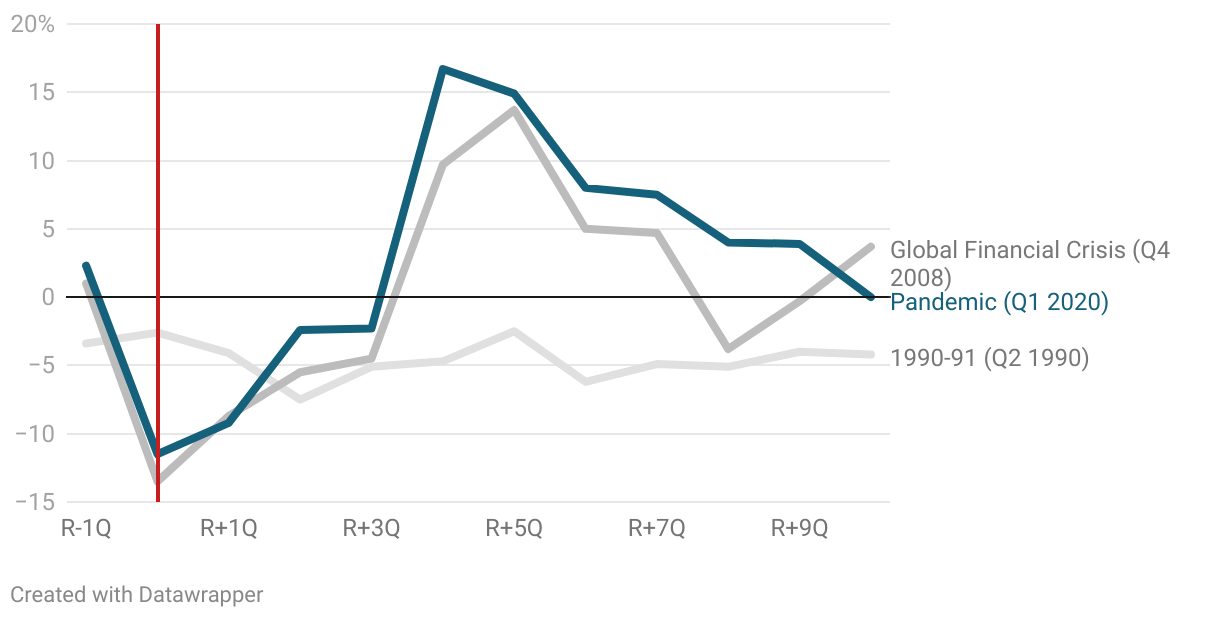
Figure 5: Percentage point profit contribution to inflation (y/y) by recession/recovery
Percentage change year-over-year by quarter, beginning one quarter before recession.
Red line indicates beginning of recession.
Figure 5: Line chart of the contribution of profit to inflation in three recessions: 1990-91, the Global Financial crisis, and the pandemic. Values are the percentage change year-over-year by quarter from one quarter before the recession to ten quarters after. The 2020-21 pandemic recession saw the most inflation dollars flow to profits of these three periods.