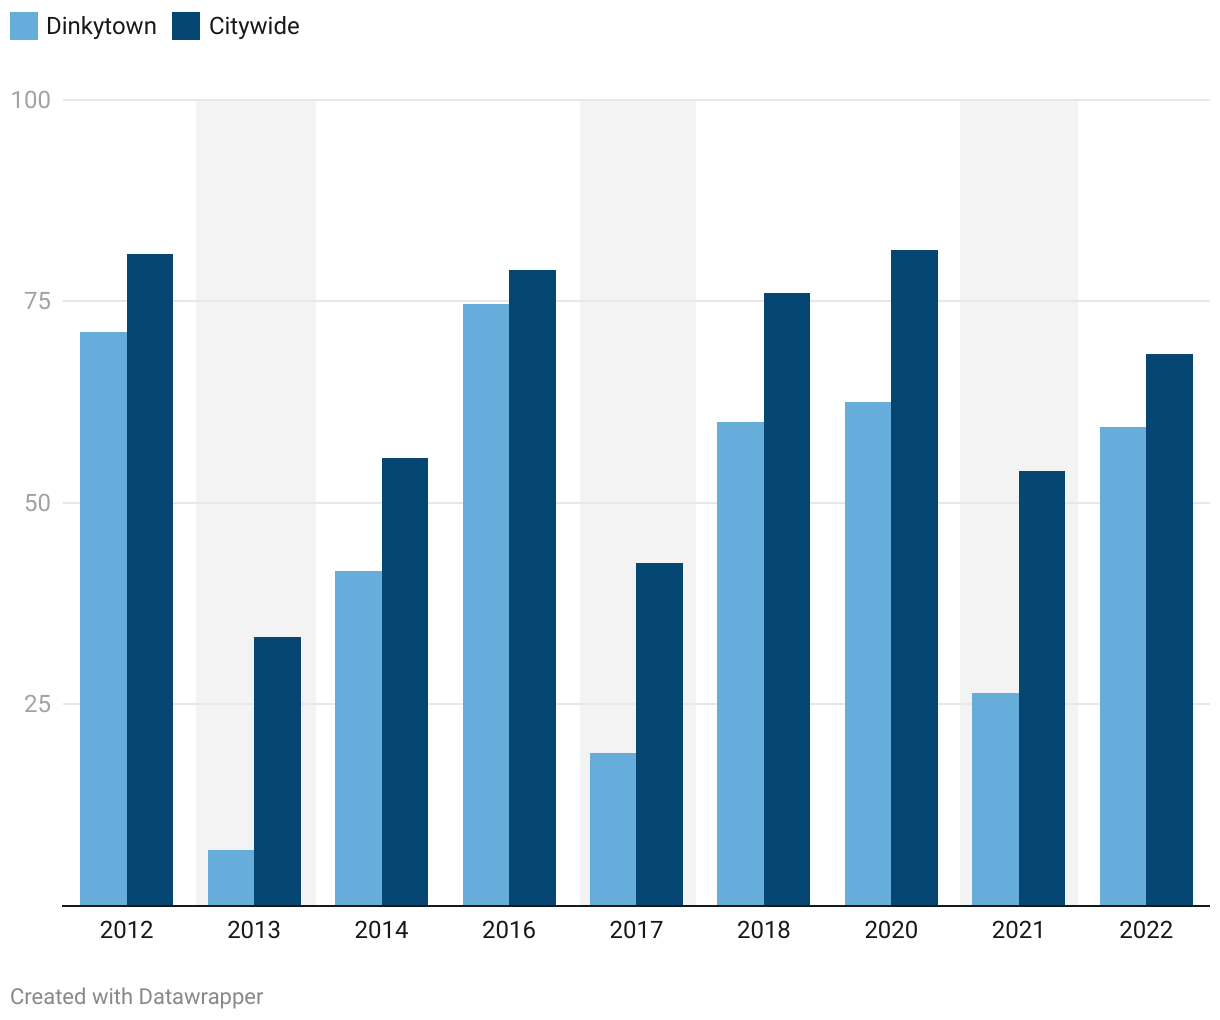
Columns compare voter turnout data for each election 2012-2022. In 2012, 2014, 2016, 2018, 2020 and 2022, turnout in Dinkytown precincts is 5-20 percentage points lower than the city average. In off-year elections, it is roughly 20-30 percentage points lower.
Dinkytown voter turnout trends below city average
In municipal election years, registered voter turnout in the precincts encompassing Dinkytown trends markedly lower than than average turnout citywide.