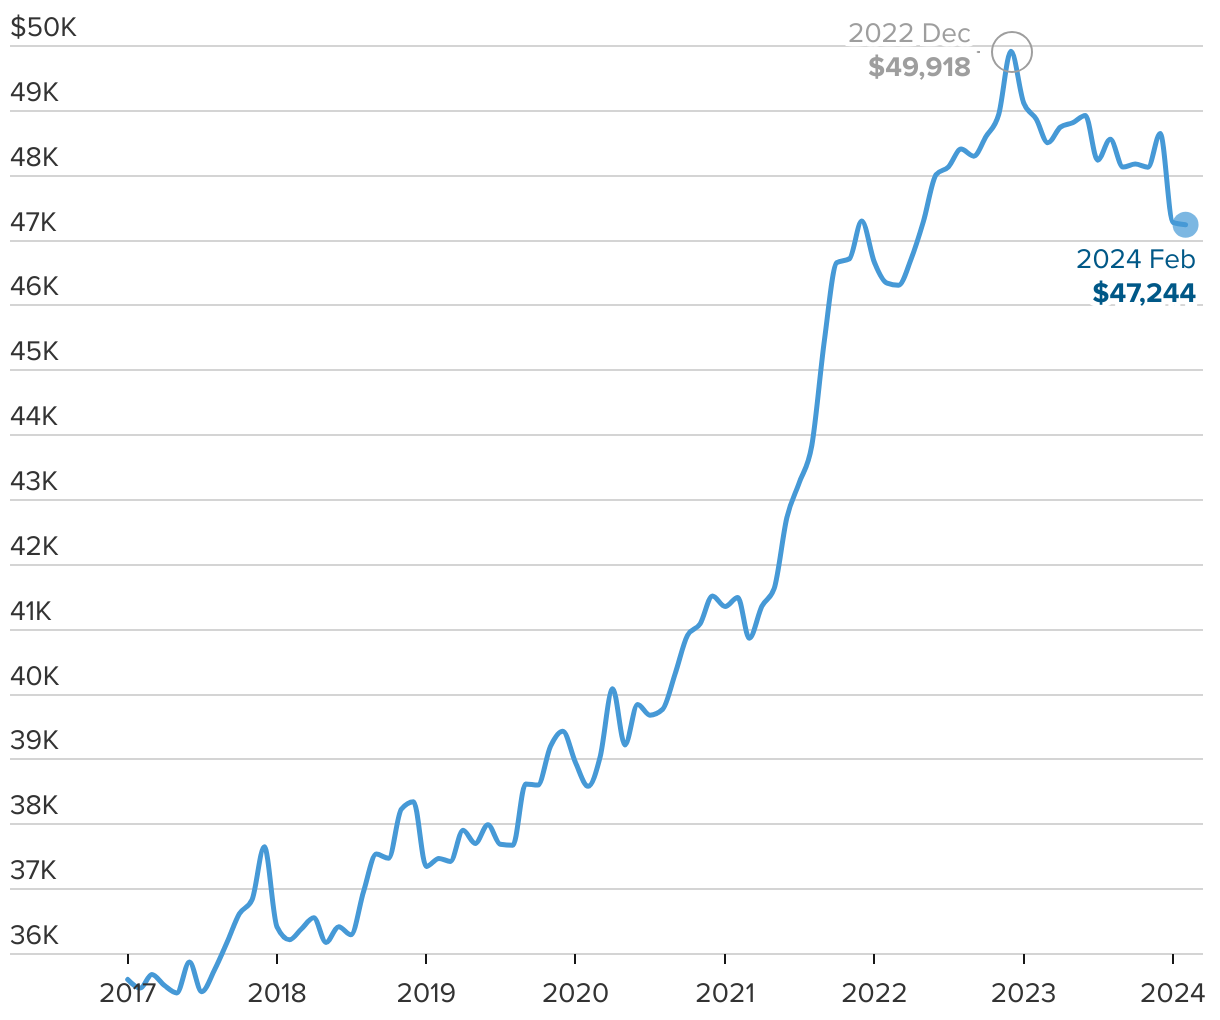
Average transaction price for new cars in the U.S.
January 2017–February 2024
The line chart shows the monthly average transaction price of a new car in the U.S. from January 2017 through February 2024.
(Please use a modern browser to see the interactive version of this visualization)