Quality results — total met / not met
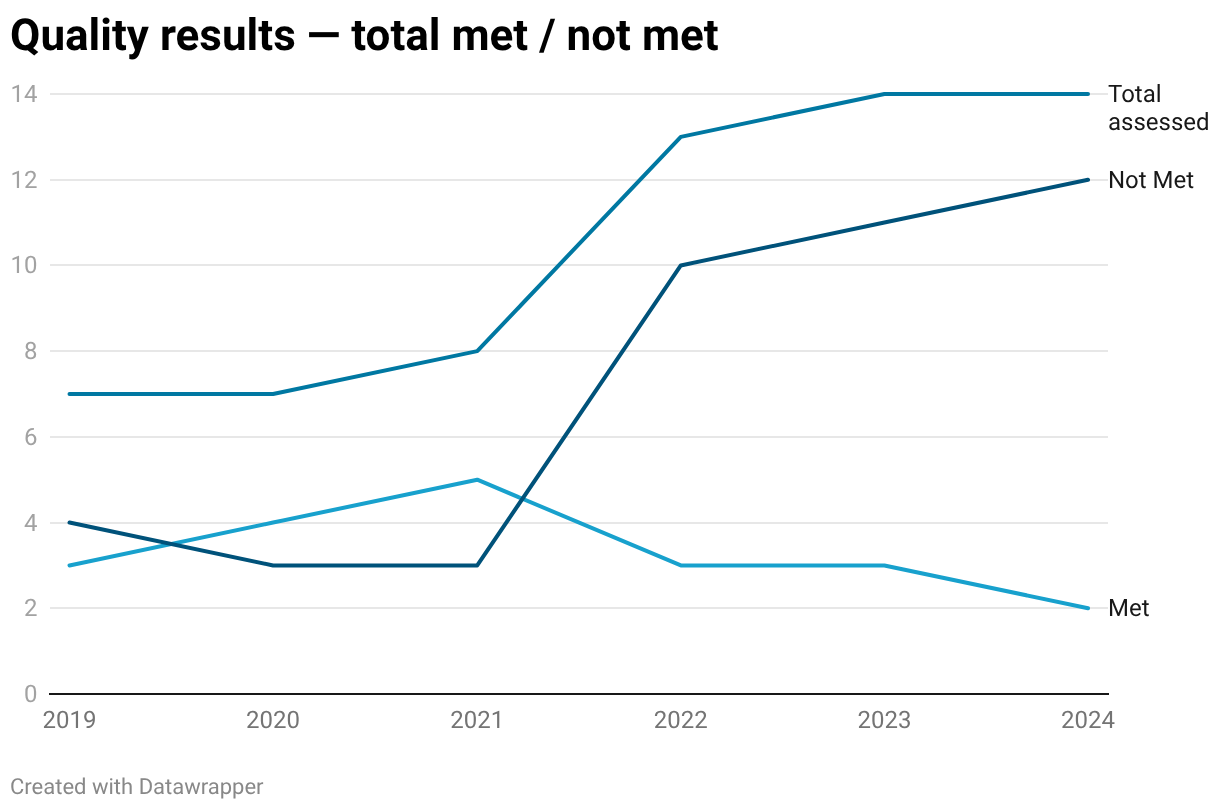
Line chart of quality results from 2019 to 2024. Measures met rose from 3 to 5 by 2021, then fell to 2 in 2024. Measures not met rose from 4 to 12, while the total assessed grew from 7 to 14.
(Please use a modern browser to see the interactive version of this visualization)