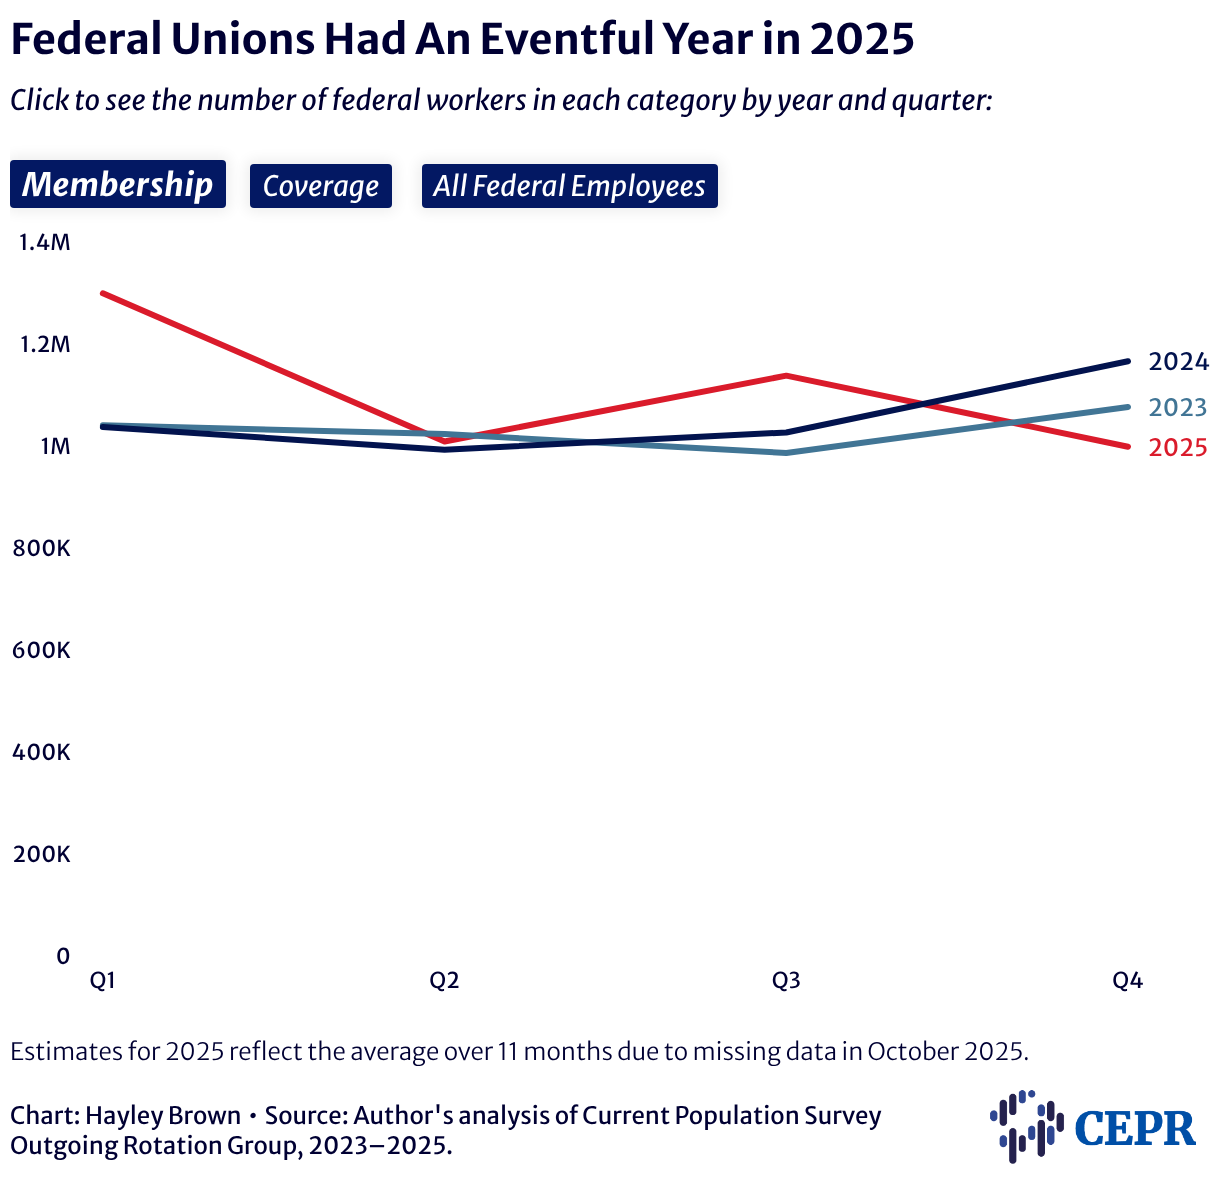
Federal Unions Had An Eventful Year in 2025
Click to see the number of federal workers in each category by year and quarter:
Membership
Coverage
All Federal Employees
Drop-down menu line chart showing (1) the number of federal union members, (2) the number of federal workers covered by a union contract, and (3) the total number of federal workers by quarter for 2023, 2024, and 2025. Among union members and union-covered workers, the 2025 series (red) starts notably higher in the first quarter, declines sharply in the second quarter, rebounds a bit in the third quarter, and falls again by the fourth quarter. In contrast, 2023 (medium blue) and 2024 (navy) show relatively steadier patterns with gradual increases toward year-end. Overall, federal unionization fluctuates much more sharply in 2025 than in the prior two years. However, overall federal employment appears far less volatile than union membership and coverage.

Estimates for 2025 reflect the average over 11 months due to missing data in October 2025.