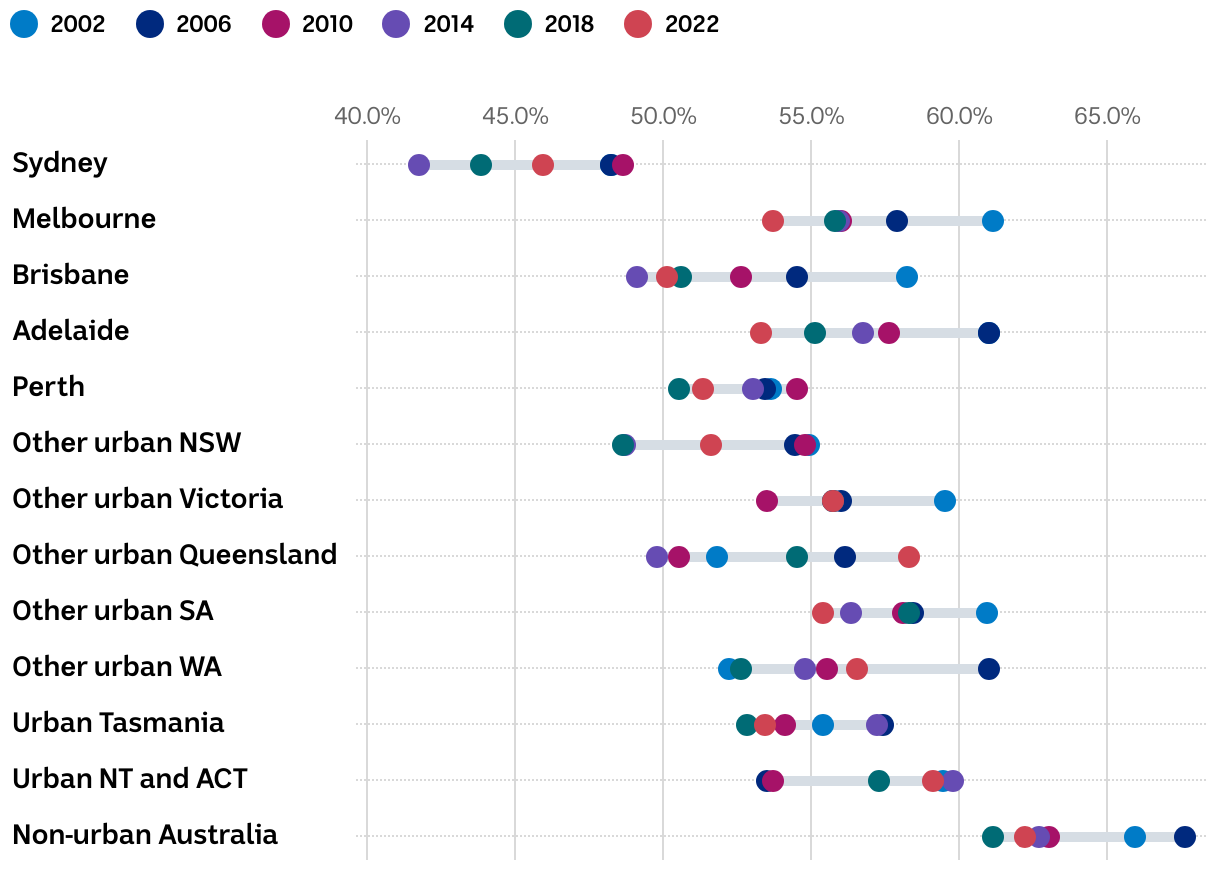
Rates of home ownership by region by people aged 18 and over, 2002 to 2022 (%)
2002
2006
2010
2014
2018
2022
40.0%
42.0%
44.0%
46.0%
48.0%
50.0%
52.0%
54.0%
56.0%
58.0%
60.0%
62.0%
64.0%
66.0%
68.0%
Sydney
48.2%
48.2%
48.6%
41.7%
43.8%
45.9%
Melbourne
61.1%
57.9%
56.0%
55.9%
55.8%
53.7%
Brisbane
58.2%
54.5%
52.6%
49.1%
50.6%
50.1%
Adelaide
61.0%
61.0%
57.6%
56.7%
55.1%
53.3%
Perth
53.6%
53.4%
54.5%
53.0%
50.5%
51.3%
Other urban NSW
54.9%
54.4%
54.8%
48.7%
48.6%
51.6%
Other urban Victoria
59.5%
56.0%
53.5%
55.7%
55.7%
55.7%
Other urban Queensland
51.8%
56.1%
50.5%
49.8%
54.5%
58.3%
Other urban SA
60.9%
58.4%
58.1%
56.3%
58.3%
55.4%
Other urban WA
52.2%
61.0%
55.5%
54.8%
52.6%
56.5%
Urban Tasmania
55.4%
57.4%
54.1%
57.2%
52.8%
53.4%
Urban NT and ACT
59.4%
53.5%
53.7%
59.8%
57.3%
59.1%
Non-urban Australia
65.9%
67.6%
63.0%
62.7%
61.1%
62.2%