UK Children's Daily Time Use, 1975-2015
Percent Change Since 1975
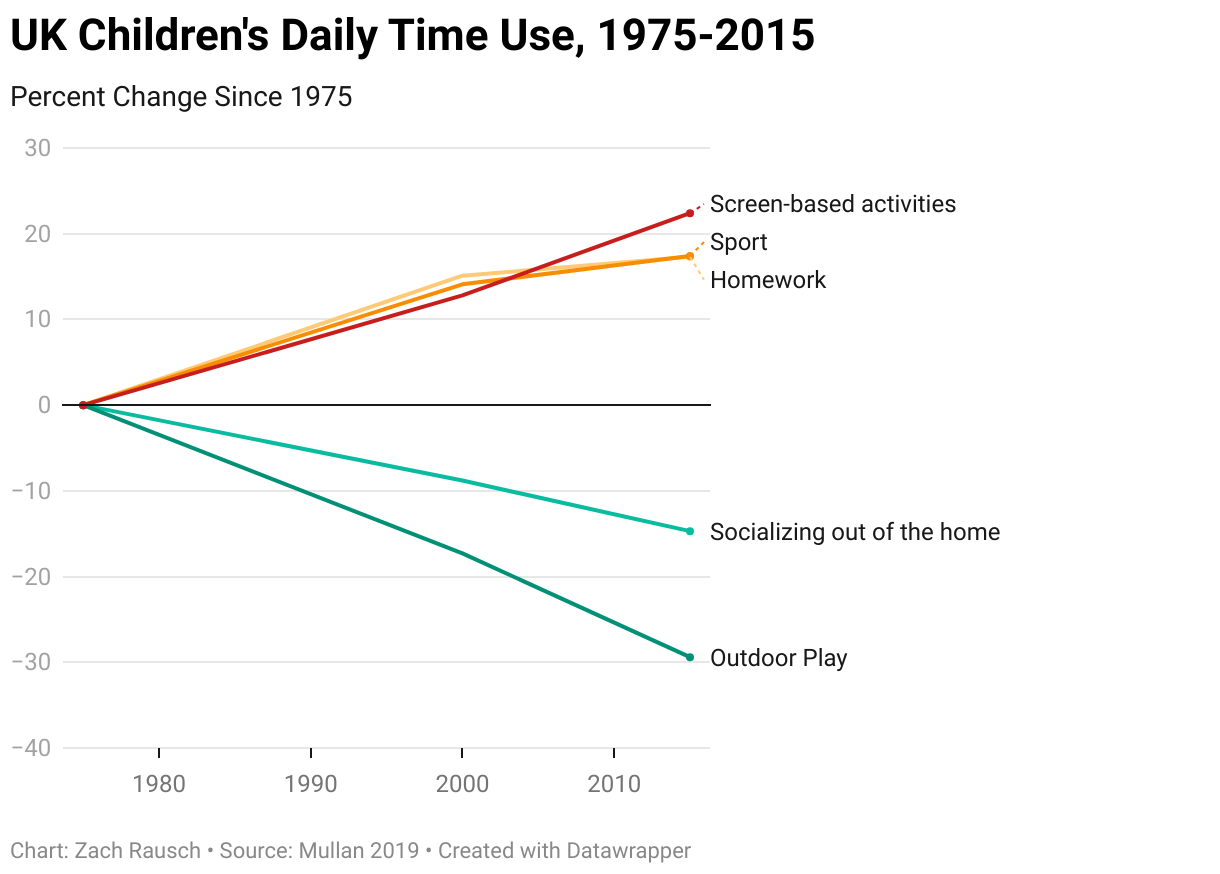
A line chart of the percent changes in time spent by UK children per day on various activities from 1975, until 2015. By 2015, time spent on screen-based activities increased by 22.4%, and sports and homework both increased by about 17%, while socializing out of the home decreased by 14.7% and outdoor play decreased by 29.4%.
