Change in GP and patient numbers since September 2015

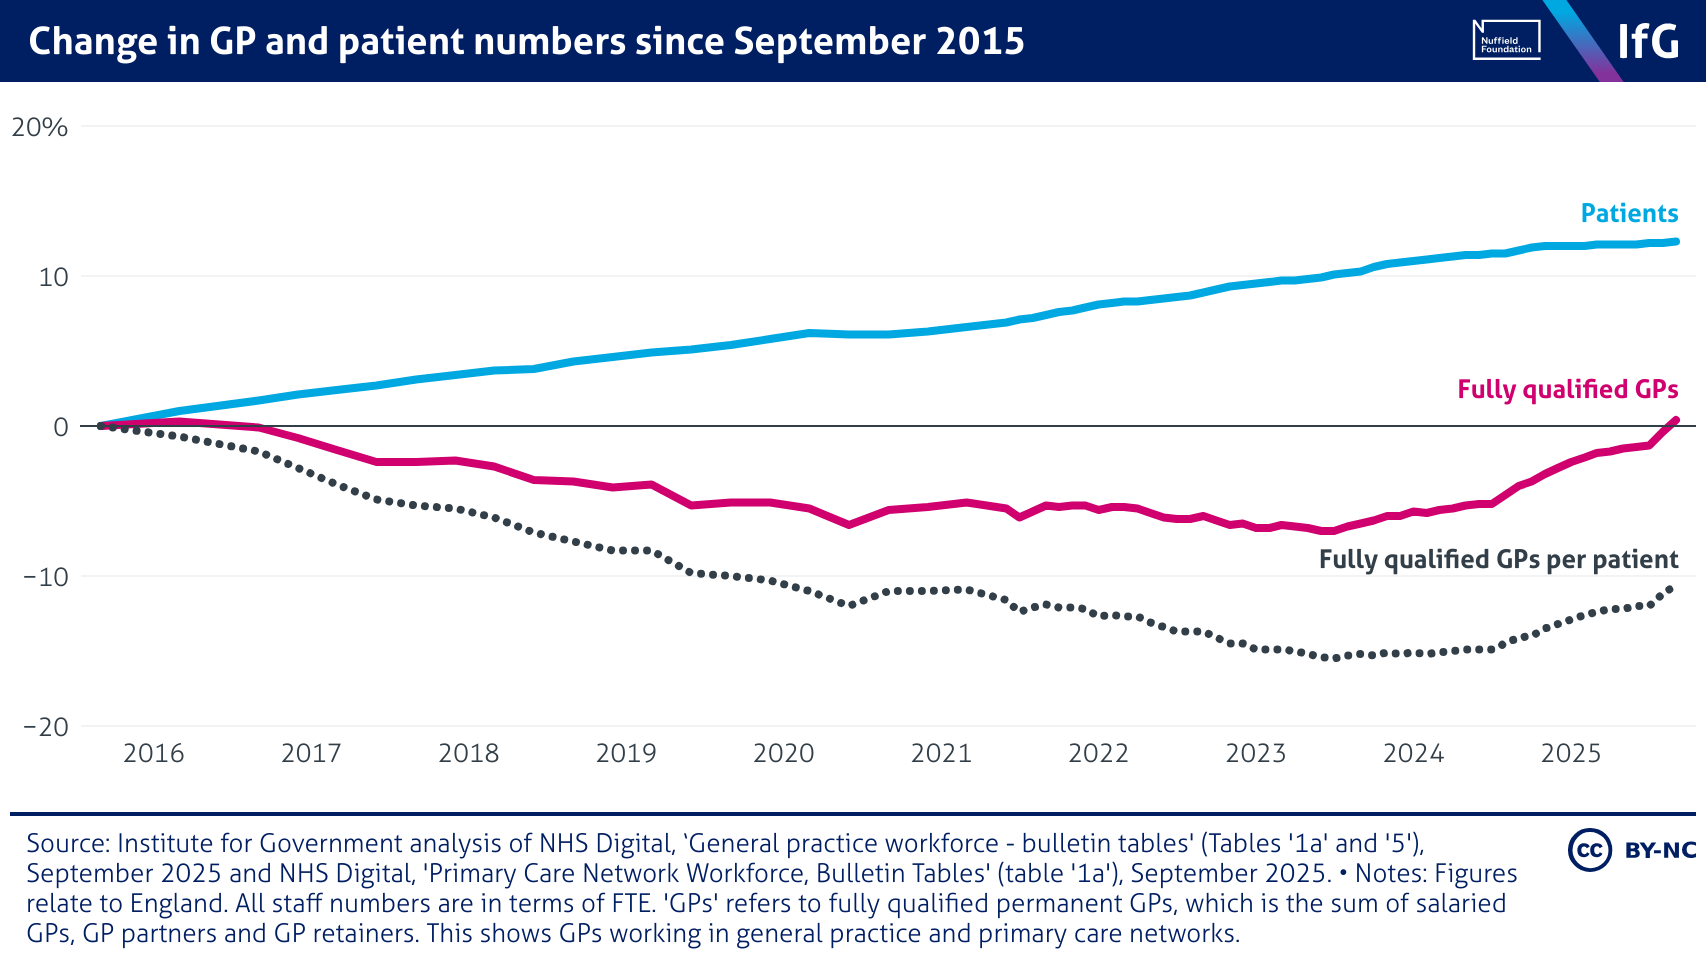
A line chart from the Institute for Government showing change in GP and patient numbers since September 2015, where patient numbers have risen steadily while GP numbers have fallen. By 2025, the number of patients is up by 12.3%, while fully qualified GPs are roughly unchanged, following years of decline. As a result, the number of GPs per patient has fallen by around 10.6%.

