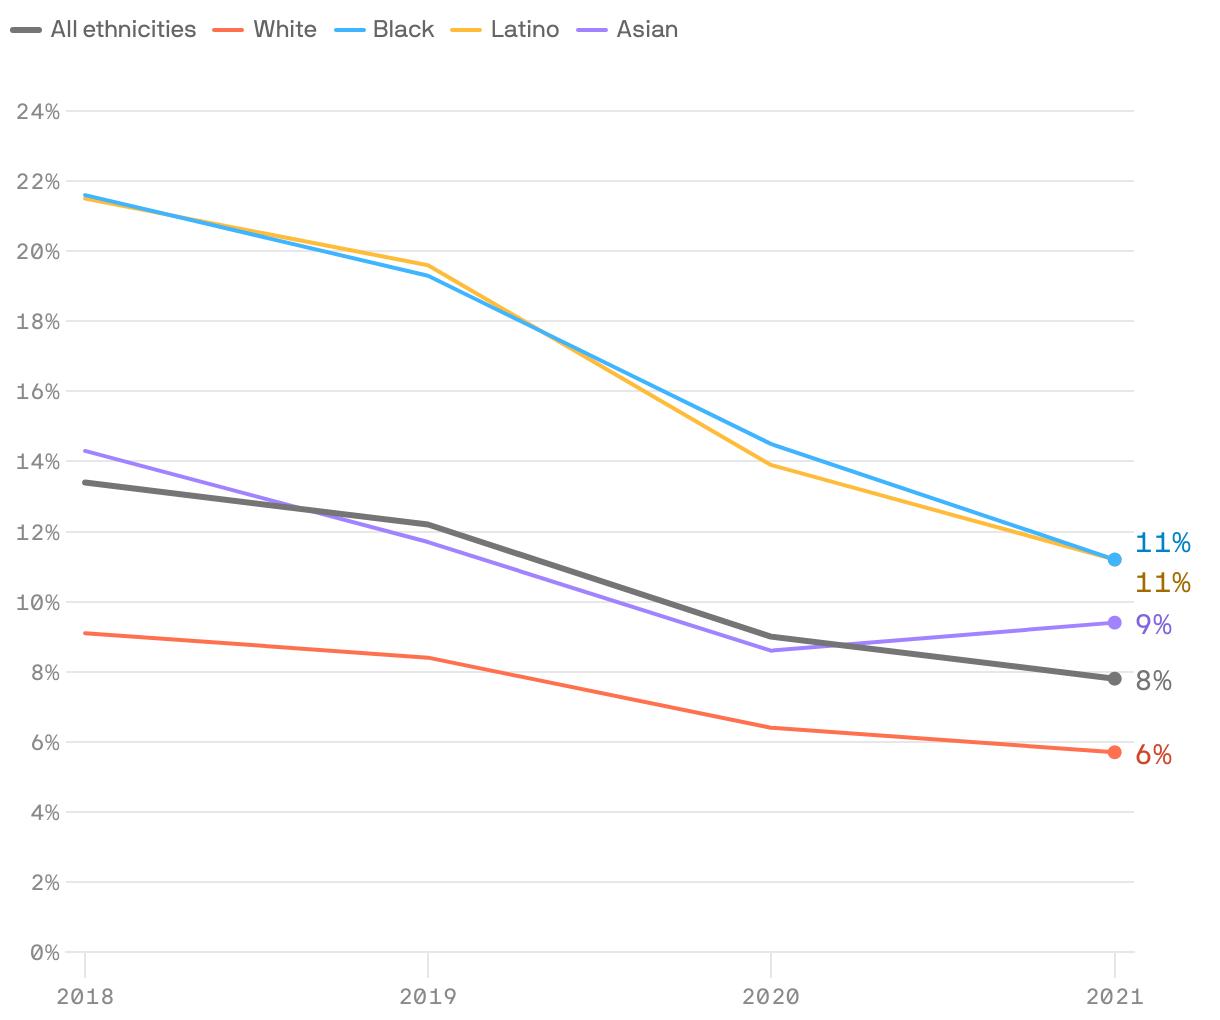
Percentage of people below the poverty line
2018–2021; For U.S. adults and children using 2021 Supplemental Poverty Measure adjusted for inflation
A line chart showing the number of people in the U.S. below the poverty line from 2018 to 2021 by race/ethnicity. The values decrease for every group from an average of 14% to 8% for the "all races and ethnicities" category. Whites have the lowest levels of poverty, while Blacks and Latinos have the highest.