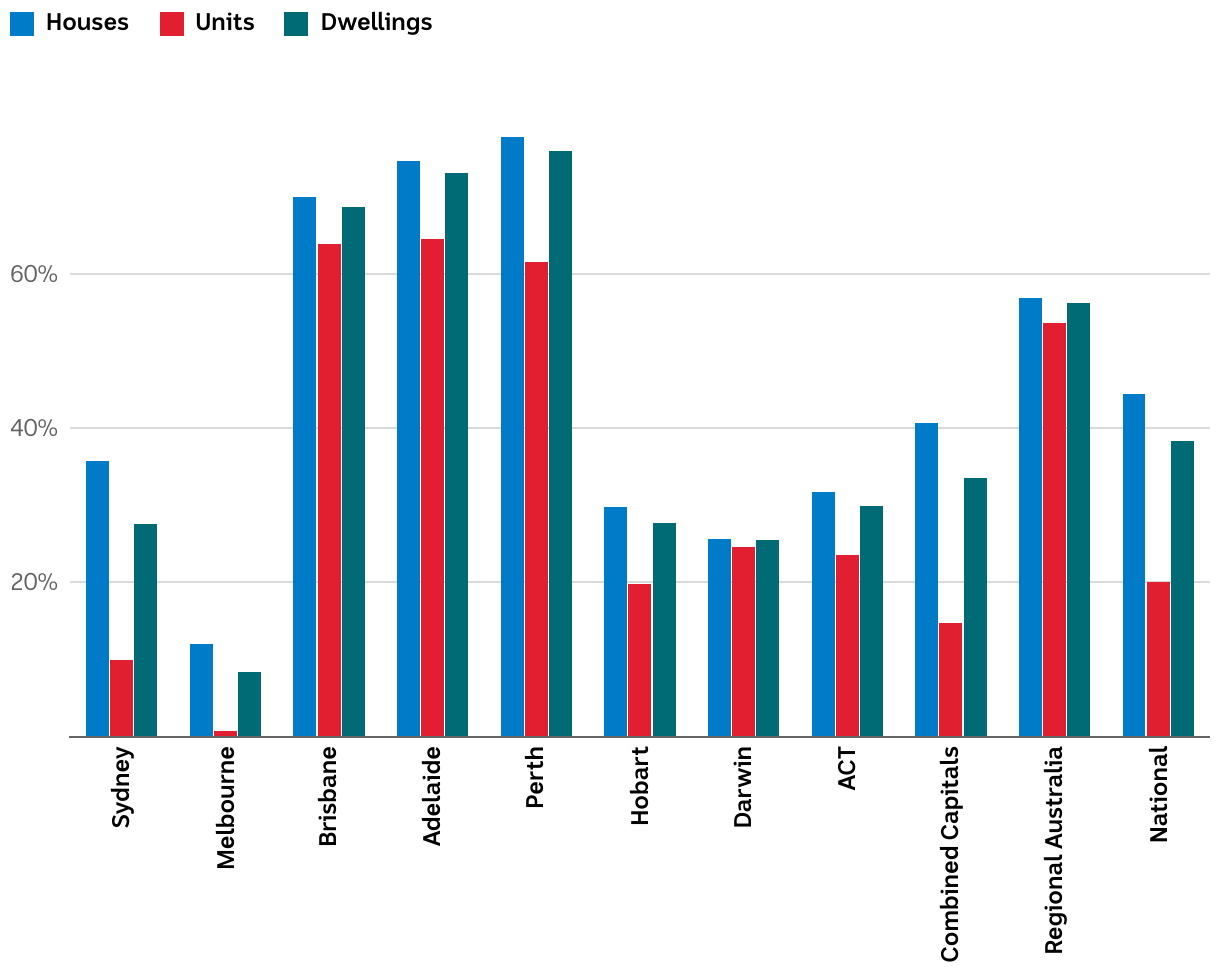
Percentage change in housing values since March 2020
Houses
Units
Dwellings
0%
20%
40%
60%
35.8%
9.9%
27.6%
12%
0.7%
8.4%
70%
63.9%
68.7%
74.6%
64.6%
73.1%
77.8%
61.5%
75.9%
29.8%
19.8%
27.7%
25.6%
24.6%
25.5%
31.7%
23.6%
29.9%
40.7%
14.8%
33.6%
56.9%
53.7%
56.3%
44.5%
20.1%
38.4%
Sydney
Melbourne
Brisbane
Adelaide
Perth
Hobart
Darwin
ACT
Combined Capitals
Regional Australia
National