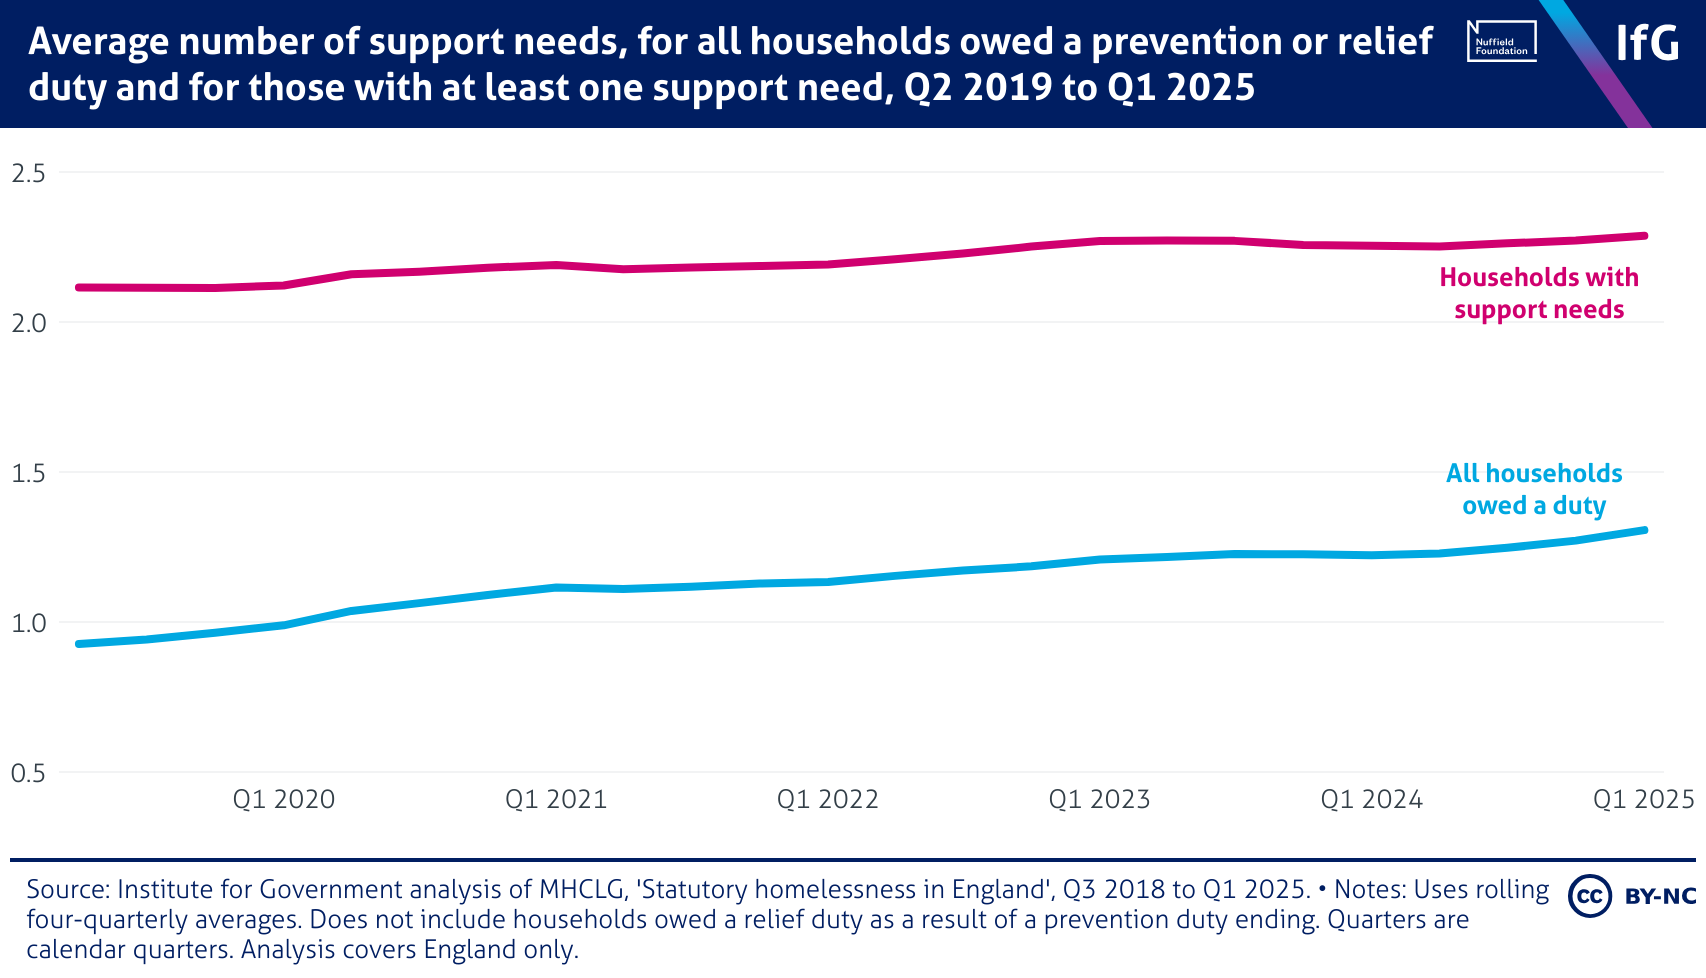
Average number of support needs, for all households owed a prevention or relief duty and for those with at least one support need, Q2 2019 to Q1 2025

A line chart from the Institute for Government of the average number of support needs, for all households owed a prevention or relief duty and for those with at least one support need, Q2 2019 to Q1 2025 where support needs are now identified across a broader spread of households but the number recorded among those with at least one support need has increased more modestly.

