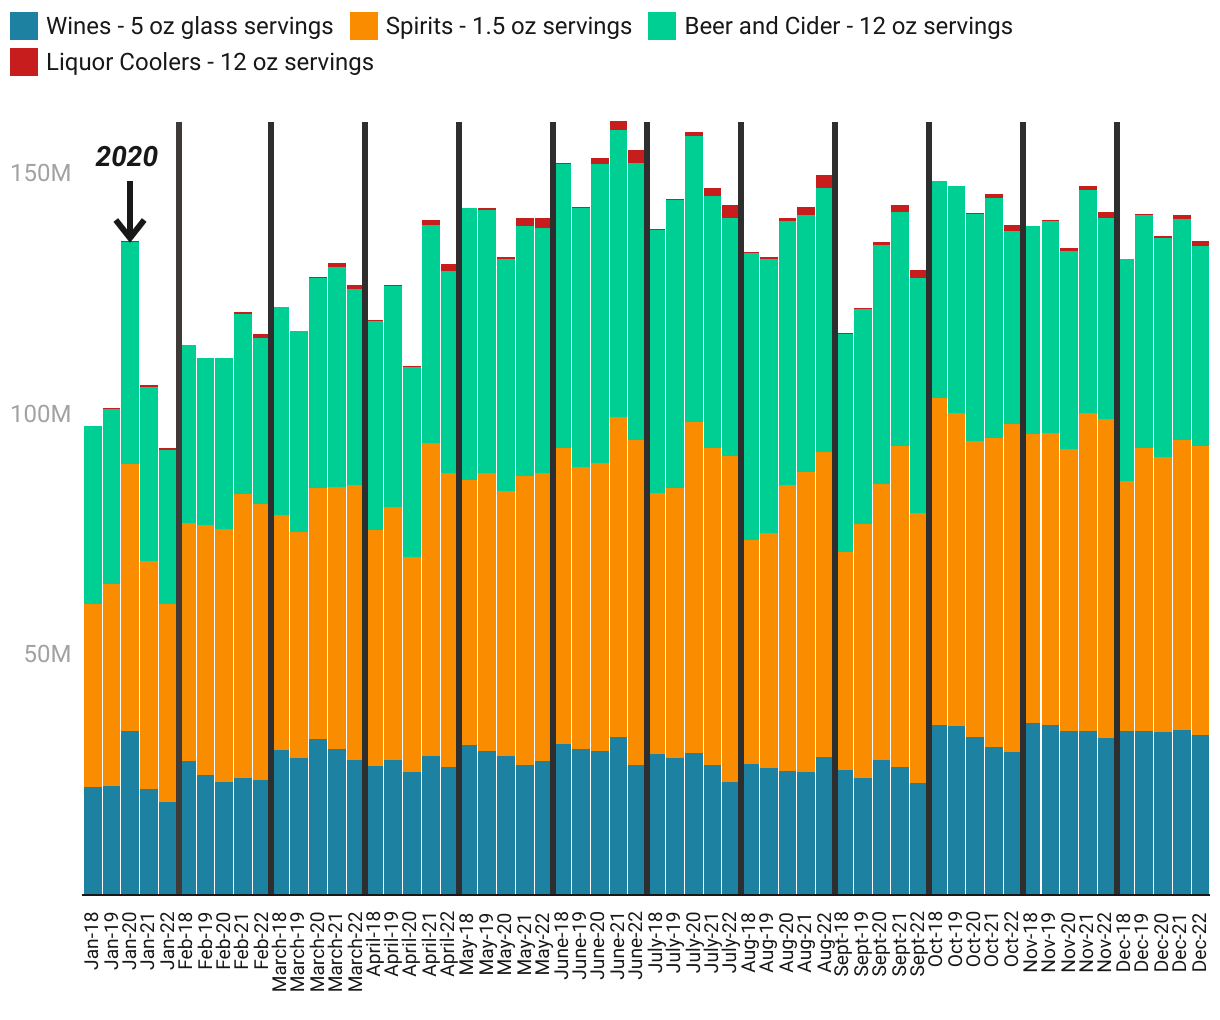
Beer sales went up during the first pandemic summer
The chart shows the amount of alcohol that was bought by retailers from wholesalers. The state collects sales tax data per gallon sold, but this chart shows the equivalent number of typical servings by type of alcohol.
The data is grouped by month via black lines to allow for comparison of a single month across years. The middle column in each group represents 2020.
June 2021 and July 2020 saw record-high amounts of alcohol sold, both over 158 million servings.