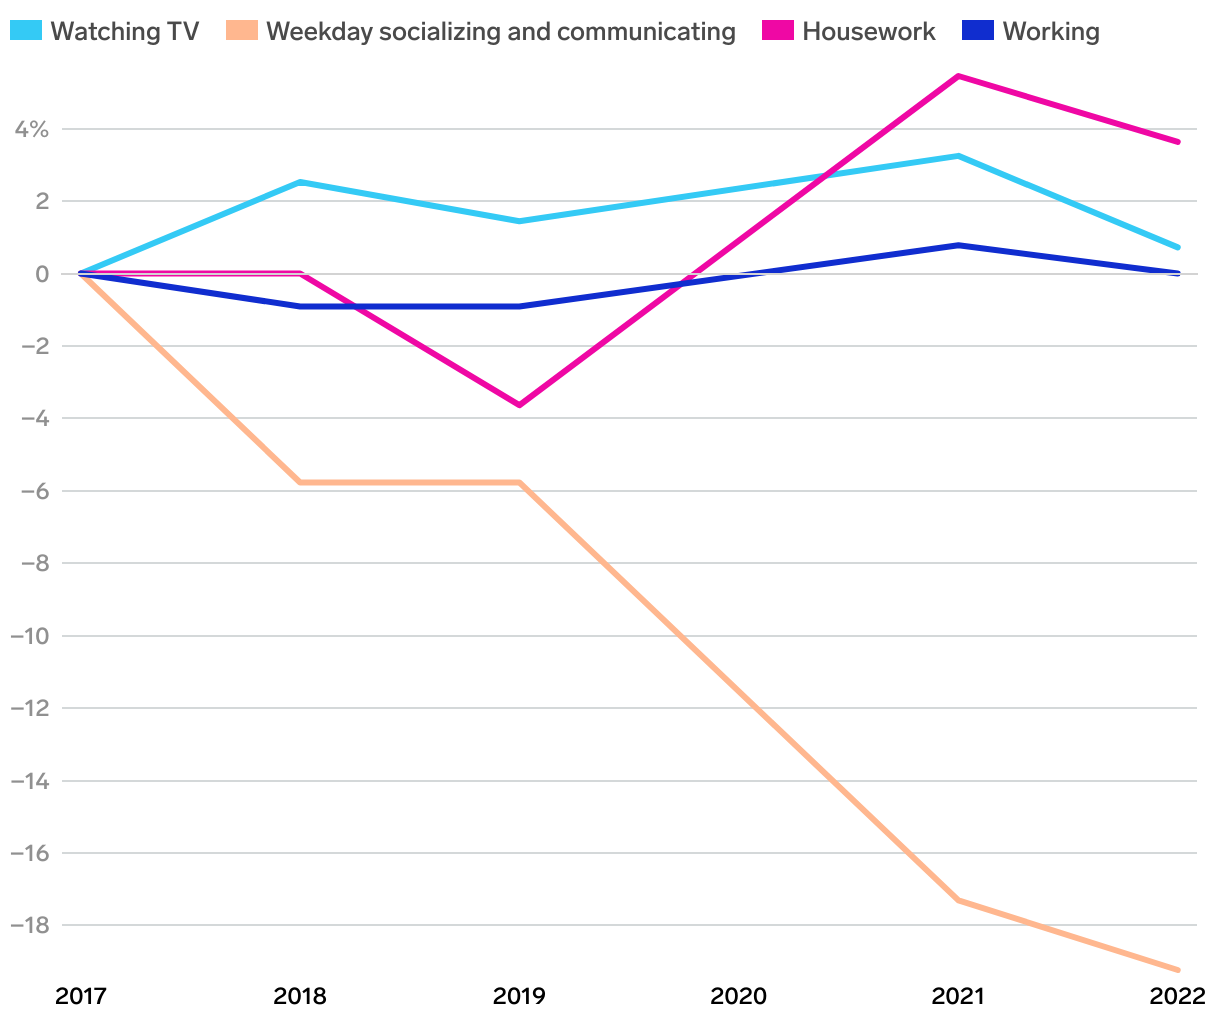
How Americans spend their time
Percent change from 2017 in average hours spent on activity
Chart depicting percentage change in how Americans spent their time watching TV, socializing, doing housework, and working.
Percent change from 2017 in average hours spent on activity