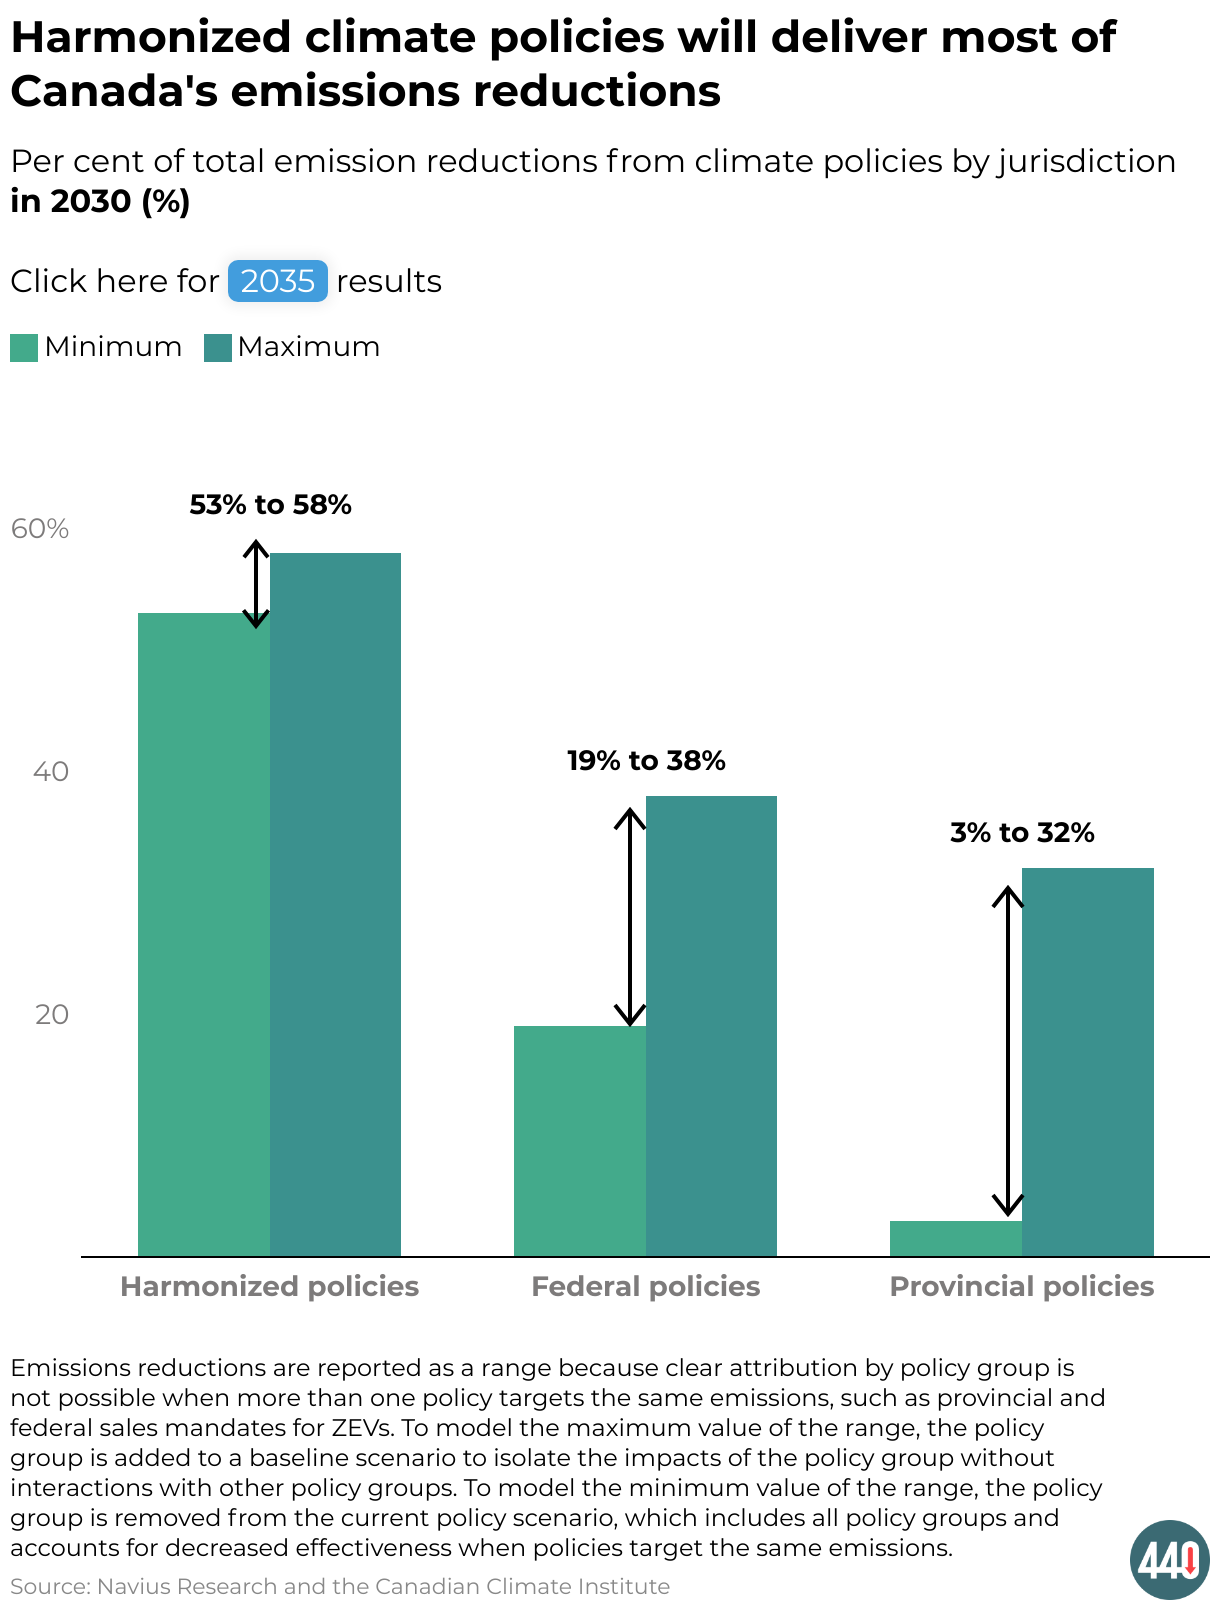
Harmonized climate policies will deliver most of Canada's emissions reductions
Per cent of total emission reductions from climate policies by jurisdiction in 2030 (%)
Click here for 2035 results
A grouped column chart showing projected reductions from policies implemented by each of 3 jurisdictions, harmonized policies, federal policies, and provincial policies. The first bar is the minimum emissions reductions for that jurisdiction and the second bar is the maximum.
