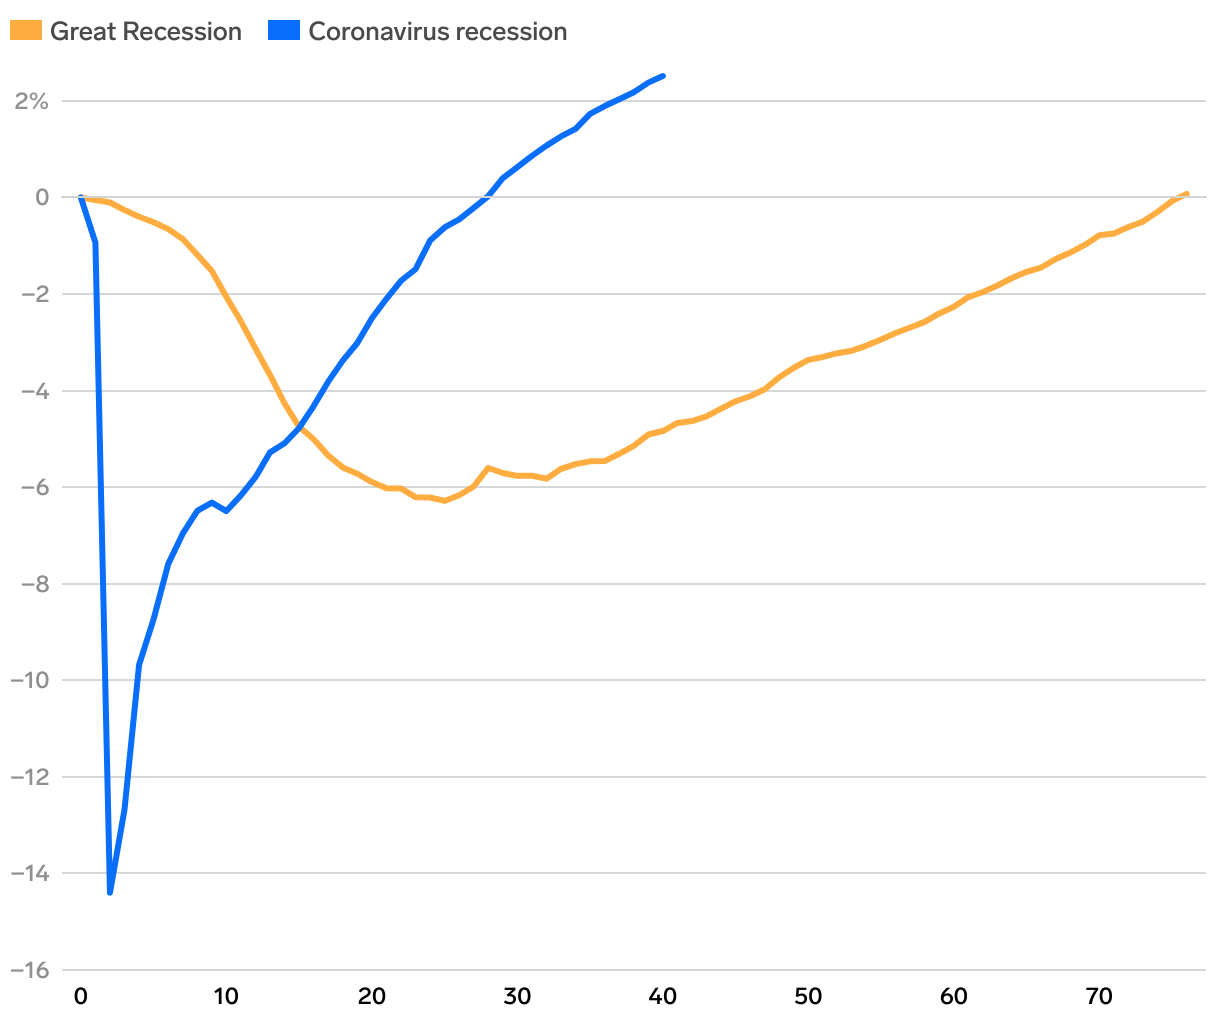
How long it took for employment to recover
Percent change in nonfarm payroll employment from pre-crisis peak
Line chart with two lines showing the percent change and number of months it took for employment to recover to its pre-recession peak for the Great Recession and pandemic. The pandemic line also shows how far growth has been since then.