4. Lost income during study a main driver of student debt
Canadian average real (2023 dollars) income and total current consumption in 2019
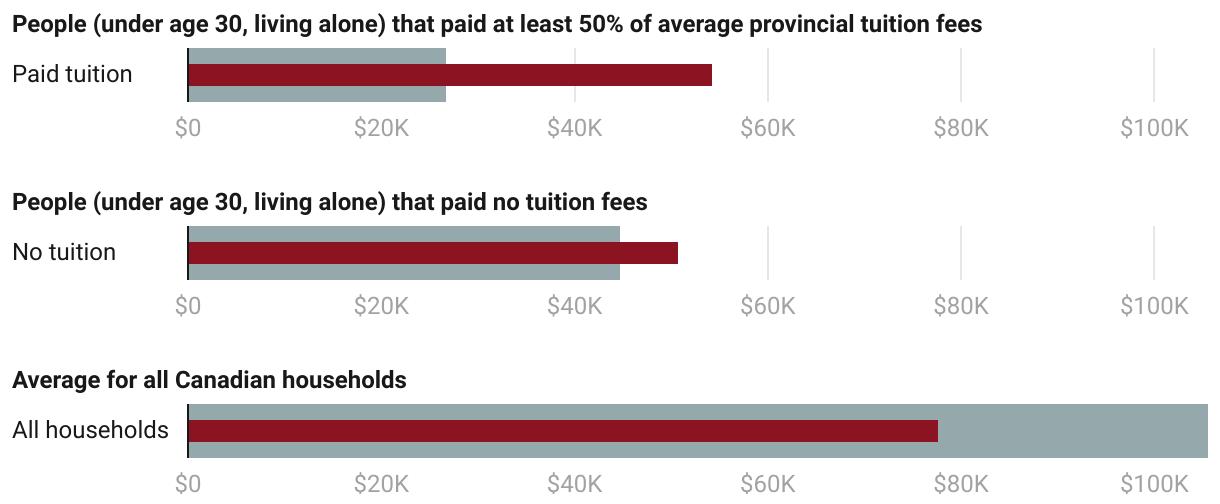
Pre-tax income versus Total current consumption
A bullet bar chart where the outer bar represents pre-tax household income and the inner bar represents total current consumption in 2019, comparing individuals under age 30, living alone, who paid at least half of average tuition versus those that paid no tuition. Those that paid tuition had an income to consumption for a gap of $27,600, while those that paid no tuition only had a gap of $5,960. By comparison, the average Canadian household had an income to consumption surplus of just under $28,000.