2022 COVID-19 Cases in Ohio - November 23
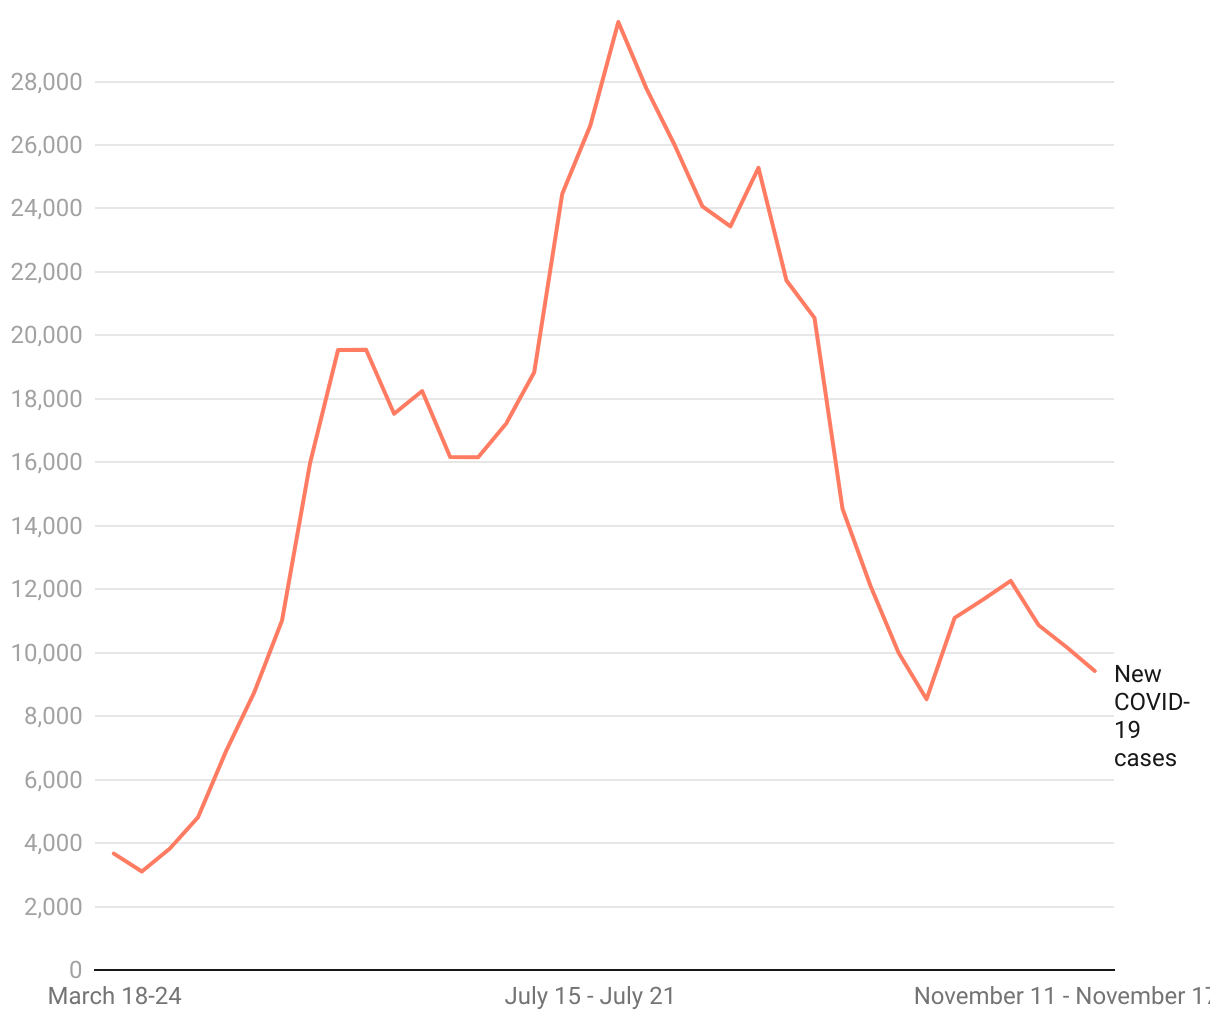
Click on different points on the line graph to see the full number of COVID-19 cases for that time period.
Click on different points on the line graph to see the full number of COVID-19 cases for that time period.