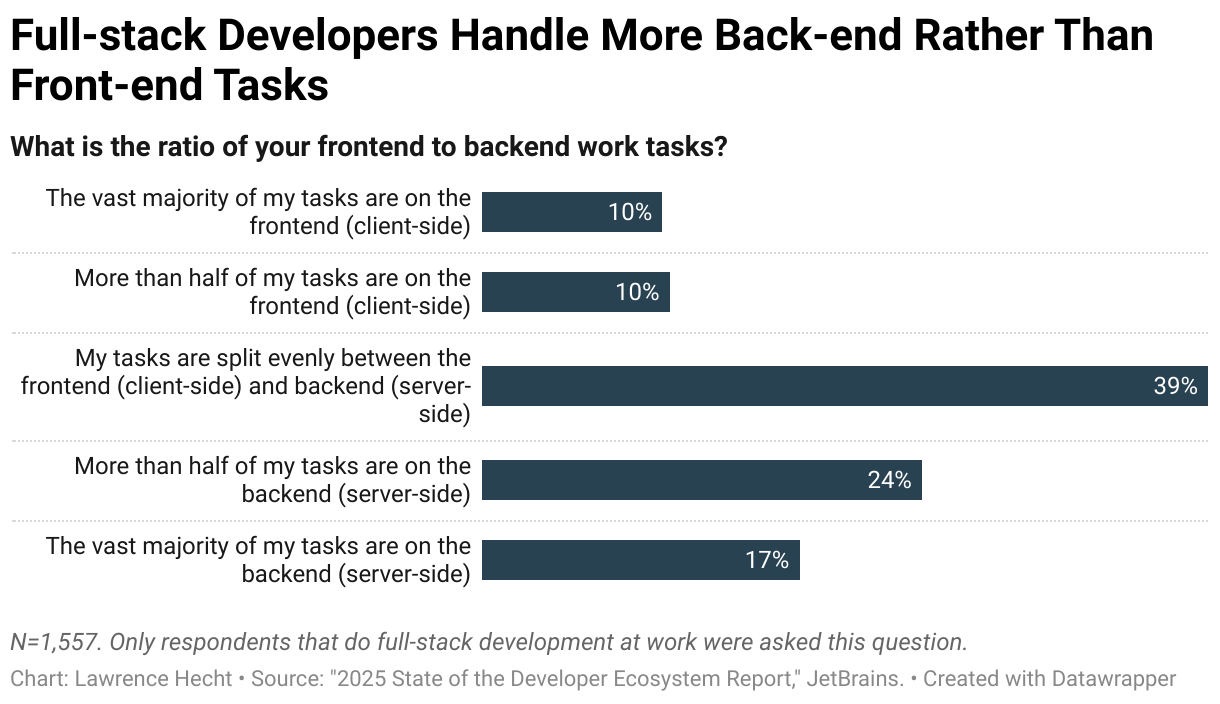
Full-stack Developers Handle More Back-end Rather Than Front-end Tasks
What is the ratio of your frontend to backend work tasks?
source: "2025 State of the Developer Ecosystem Report," JetBrains.
Question: Which of the following specific measurements does your company use to assess developer productivity or developer experience?
Developer satisfaction 49.8%
Developer engagement 44.2%
Deployment frequency 34.1%
Ease of delivery 30.7%
Lead time for changes 29.8%
Developer sentiment 29.3%
Perceived/Self-reported productivity 28.1%
Change failure rate 24.3%
Adoption rate 20.3%
Time to restore service 17.9%
Number of diffs/pull requests per developer 14.2%
Time loss 12.2%
Other 1.3%
I'm not sure 15.3%
