In Majority of Previous Recessions, Government Employment In US Did Not Display Volatile Cyclical Nature
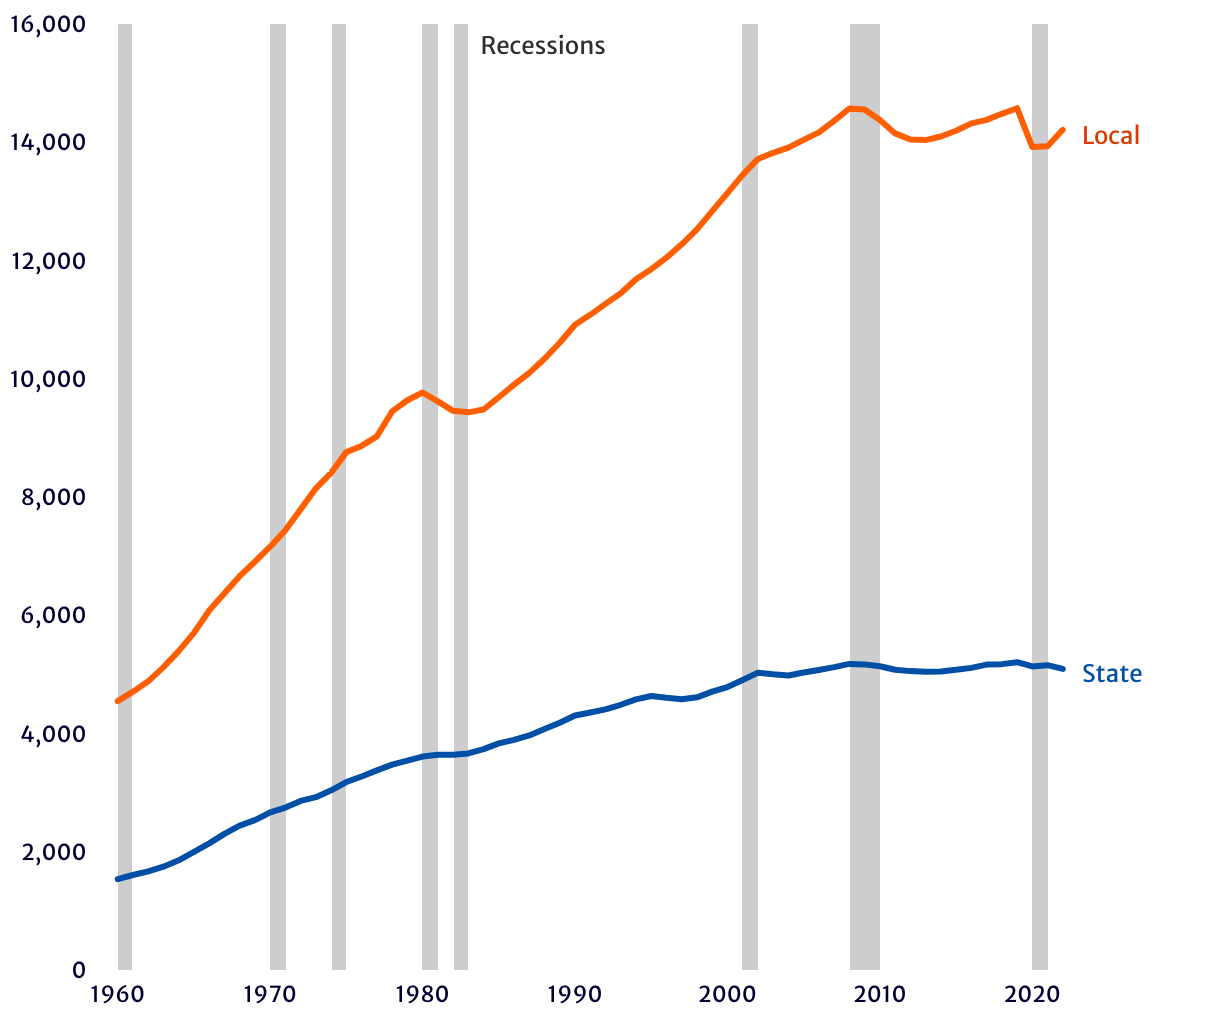
Number of state and local government employees in thousands
This figure, Figure 1, shows the number of state and local government employees in each year, from 1960 to 2022. The orange line denotes the number of local government employees and the blue line indicates the number of state government employees, in thousands. Grey bars indicate recessions, as designated by the National Bureau of Economic Research. In most recessions prior to the Great Recession, state and local government employment was not marked by the volatile cyclical phenomena that came to characterize the Great Recession and, to a less extent, the economic crisis associated with COVID-19 pandemic.
Source: Authors' analysis of Current Employment Statistics data, US Bureau of Labor Statistics, 1960-2022.