Sea Levels Rise as Global Temperatures Rise
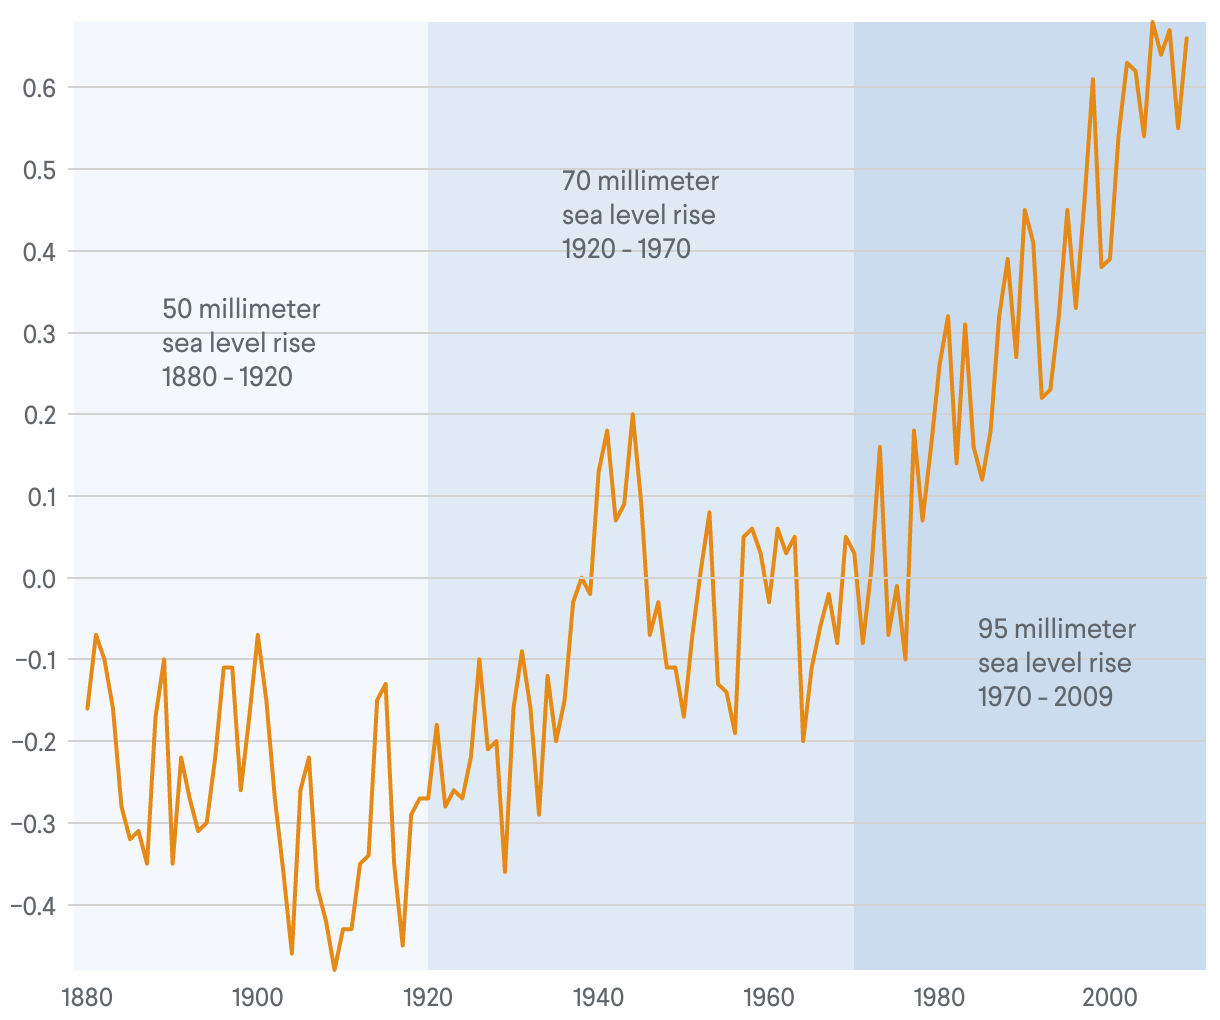
Global Annual Average Surface Air Temperature Anomaly (Degrees Celsius)
This chart depicts temperature anomalies, which show the changes in global temperature compared with the base period of 1951 to 1980. Between 1970 to 2009, the sea level rose 95 millimeters, indicating that sea levels rise as global temperatures rise.