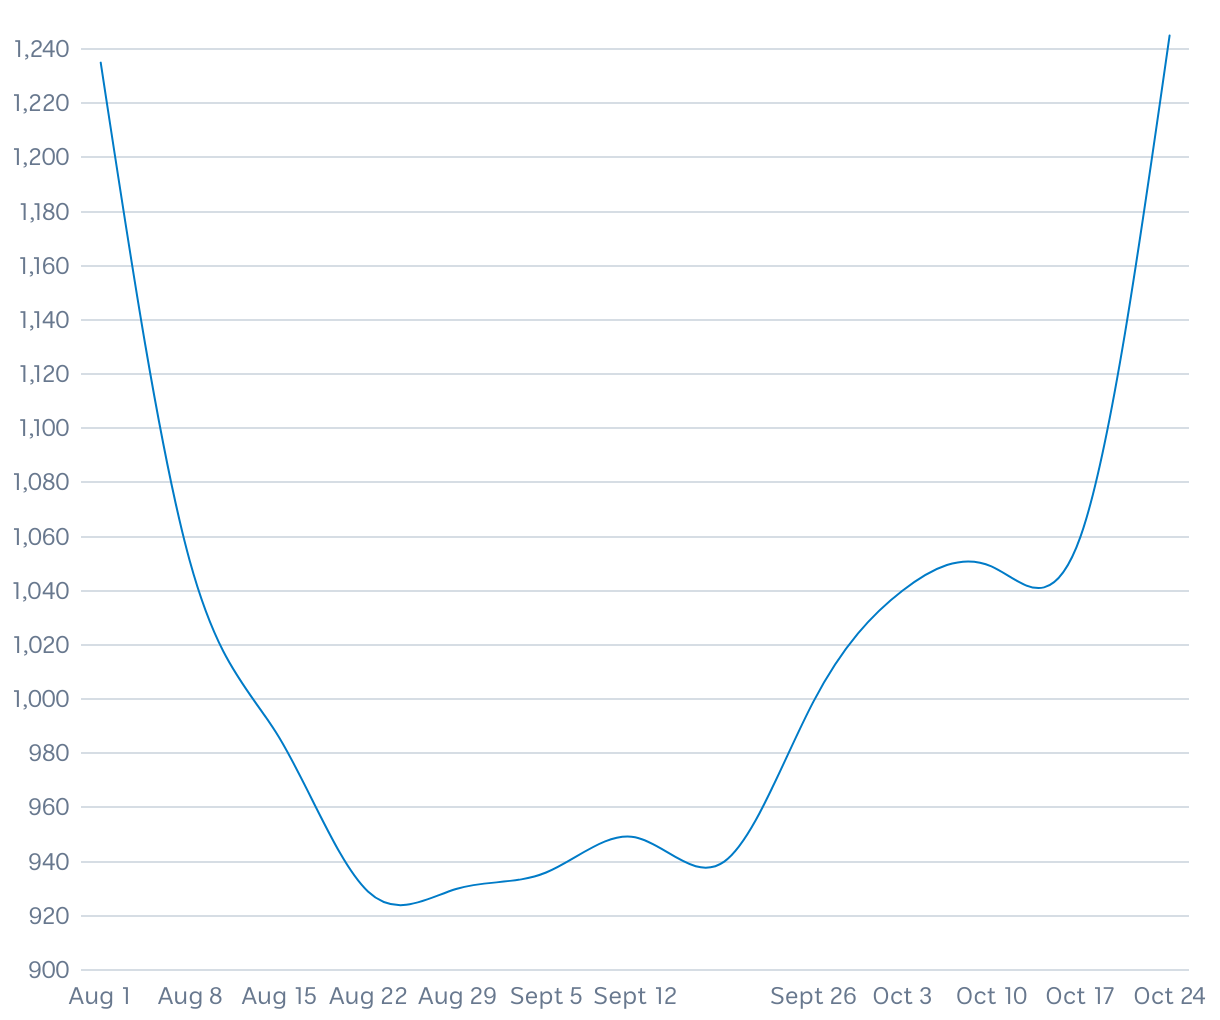
National COVID-19 cases in hospital on a 7-day rolling average
Hospitalisations between August and October 2023
A line graph showing the COVID-19 case numbers in hospital between August to October using a 7-day rolling average where cases have fallen steadily in August but has picked up in September as October's levels matches that of AUgust.