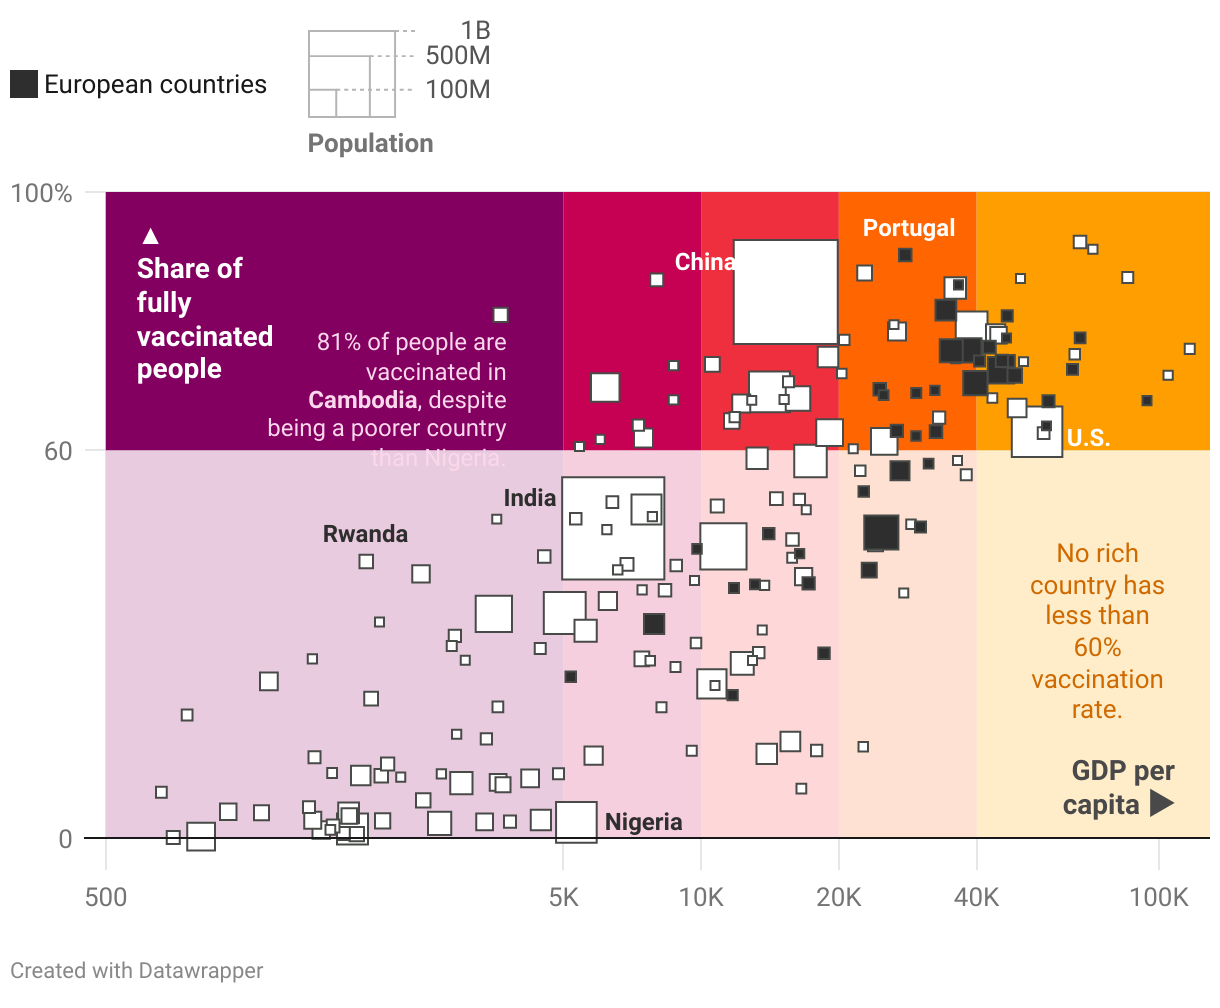
The richer the country, the more people are vaccinated
Share of the population with at least two vaccinations against COVID-19 and GDP per capita in 2011 US-Dollars for selected countries. The bigger the square, the higher the population in a country. The color groupings are arbitrary. ⚠️ The x-axis (GDP per capita) is shown on a log scale to give countries with a low GDP more space – pay attention to the axis labels.
A scatterplot showing the correlation between the share of the population with at least two vaccinations against COVID-19, and GDP per capita in 2011 US-Dollars for all countries where both data points were available. The chart shows a clear correlation between how rich a country is and how many of its people are vaccinated.