US Abortion Clinic Visits
Difference in the 7-day rolling average number
of abortion clinic visitors between 2019 and 2020
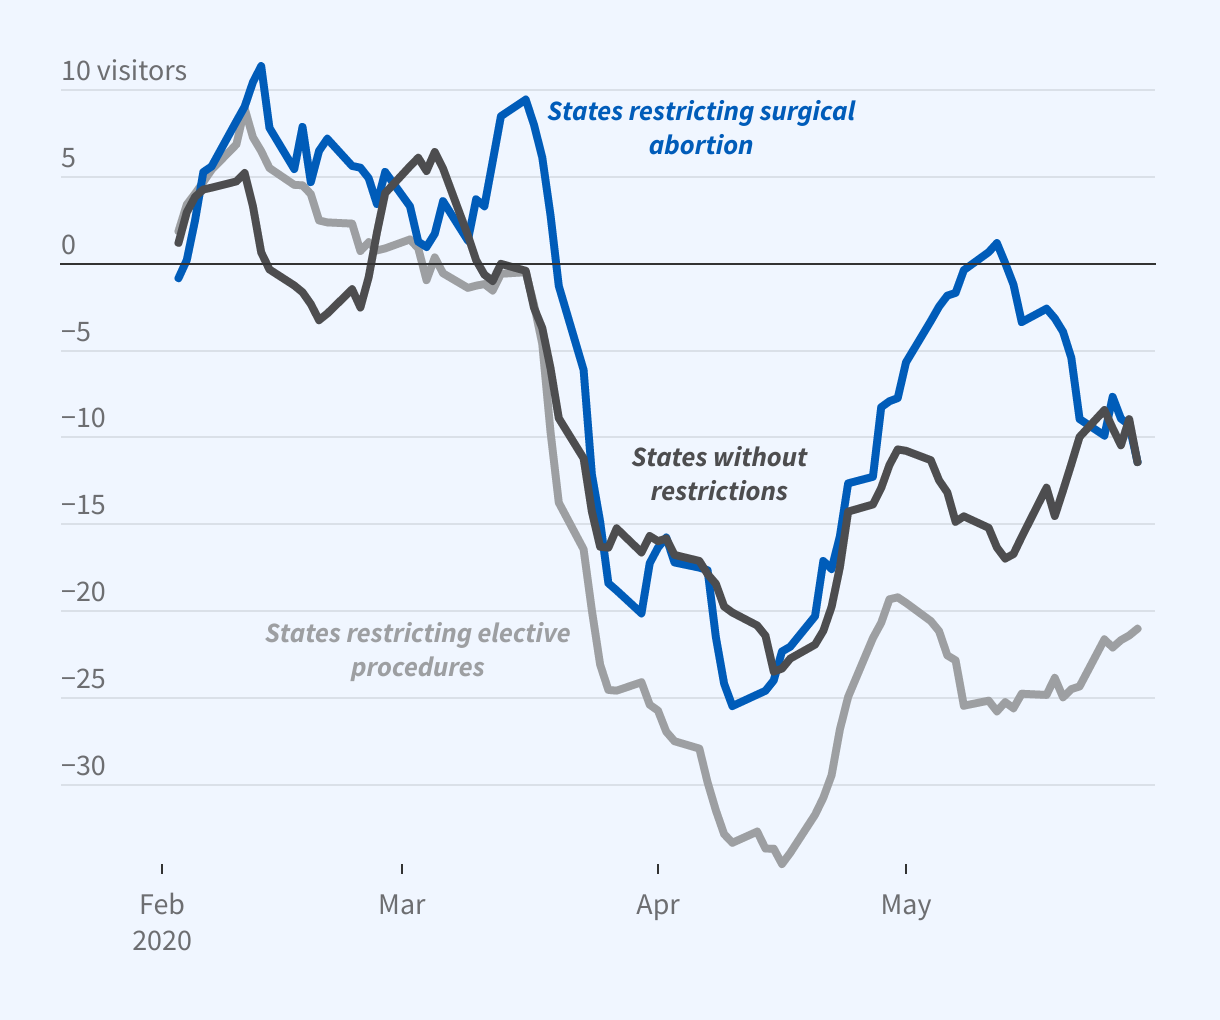
The graph is a line chart titled, “US Abortion Clinic Visits.”
The y-axis, which plots the difference in the 7-day rolling average number of abortion clinic visitors between 2019 and 2020, ranges from -30 to 10 visitors, and the x-axis goes from February 3 to May 29.
The chart shows series for states restricting surgical abortion, states without restrictions, and states restricting elective procedures.
All three series bottomed out around mid-April, with states restricting surgical abortion reaching a low of -35 visitors, and the other series reaching lows around -25 visitors.
Source: Andersen M, Bryan S, Slusky D. NBER Working Paper 28058