CSIRO’s Simple Carbon-Climate Model of emissions in gigatonnes of carbon per year
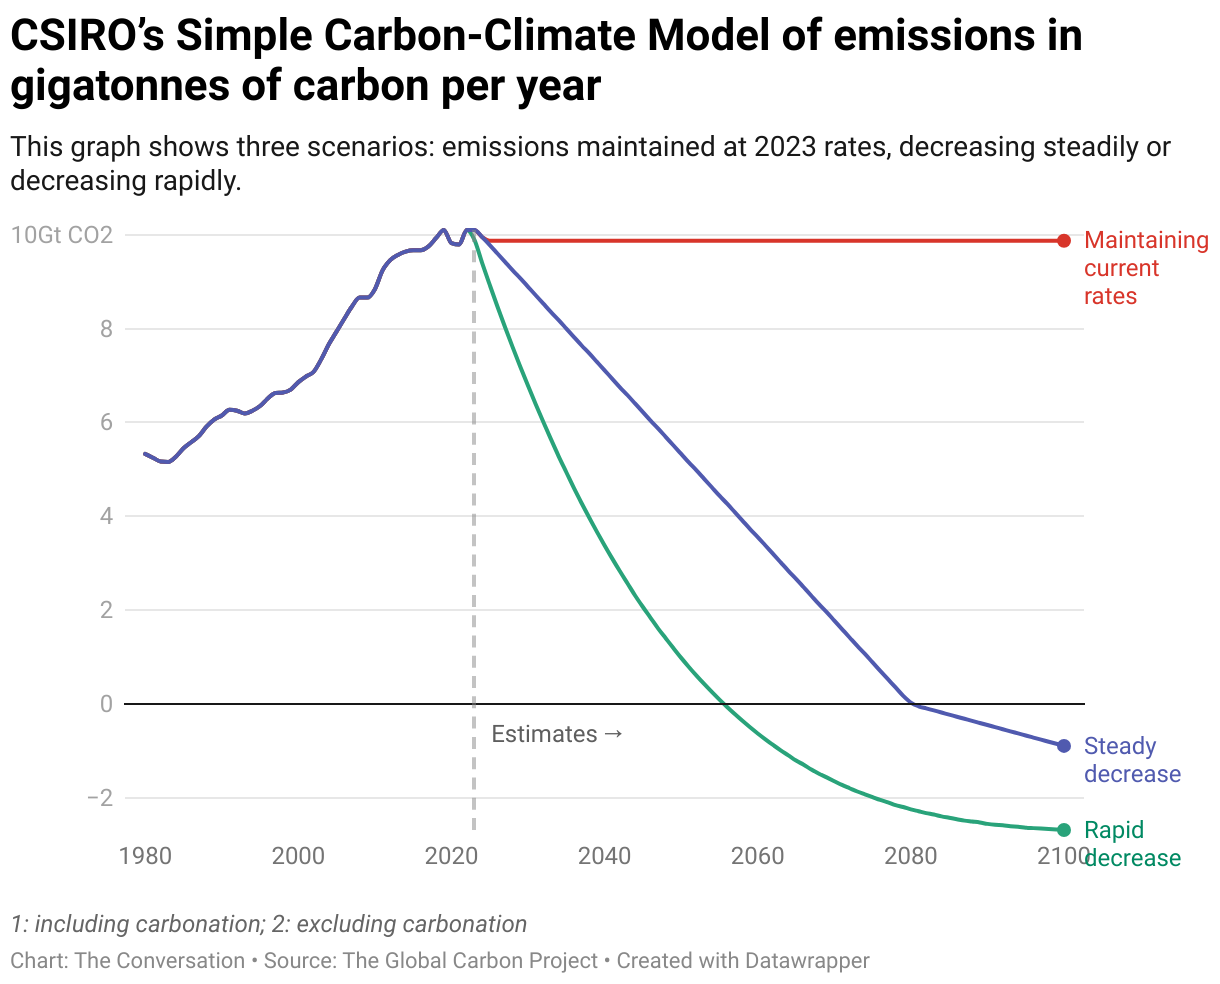
This graph shows three scenarios: emissions maintained at 2023 rates, decreasing steadily or decreasing rapidly.
This graph shows three scenarios: emissions maintained at 2023 rates, decreasing steadily or decreasing rapidly.
